Is India Going to Waste? Waste Water, Waste Management and - - PowerPoint PPT Presentation

is india going to waste
SMART_READER_LITE
LIVE PREVIEW

Is India Going to Waste? Waste Water, Waste Management and - - PowerPoint PPT Presentation

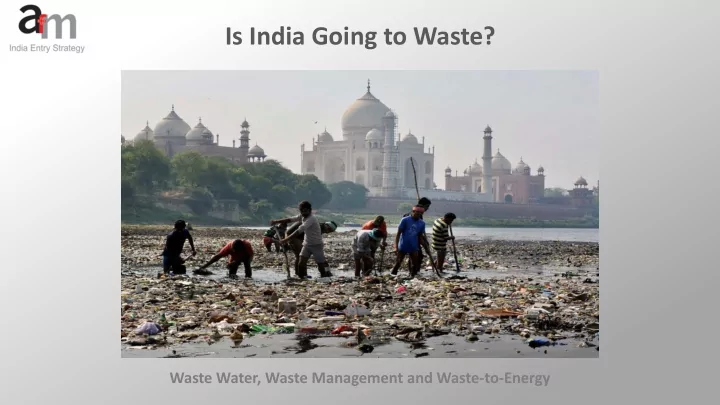
Is India Going to Waste? Waste Water, Waste Management and Waste-to-Energy India - The Market India Urbanization Market Size: Waste Water Estimated US$ 126 billion of capital investment over next 20 years to meet basic potable water and


slide-1
SLIDE 1

Is India Going to Waste?

Waste Water, Waste Management and Waste-to-Energy

slide-2
SLIDE 2
slide-3
SLIDE 3

India - The Market

slide-4
SLIDE 4

India – Urbanization

slide-5
SLIDE 5

Market Size: Waste Water

** CAGR = compounded annual growth rate

  • Estimated US$ 126 billion of capital investment over next 20 years to meet basic potable water and

sanitation needs

  • In real terms, capital expenditure on water and wastewater infrastructure poised to grow 83%

between 2015 and 2020 - ARR* of US$ 16 billion by 2020

  • Wastewater treatment expected growth of 15.3% CAGR** between 2015 and 2020 reaching US$

6.78 billion in 2020 (2015: US$ 3.3 billion)

  • Drinking water treatment and supply segment will reach US$ 9.4 billion in 2020 (2015: US$ 5.5

billion)

  • Major tenders expected for municipal wastewater treatment and water supply projects:

Ahmedabad (US$ 364 million) Bangalore (US$ 271 million) Kochi (US$ 300 million) Mumbai (Malad – US$ 296 million and Bandra – US$ 289 million)

* ARR = annual run rate

slide-6
SLIDE 6

Potential Sectors: Waste Water

  • Engineering, procurement and construction services
  • Operations services
  • Advanced filtration
  • Membrane filtration
  • Waste to energy technology
  • Anaerobic digestion
  • Nitrification
  • Biological denitrification
  • Monitoring equipment
  • Testing equipment

Municipal Water and Wastewater Treatment

  • Monitoring technology
  • Leak resistant transmission systems

Municipal Water and Efficiency

  • Engineering and construction services
  • Water reuse equipment and services
  • Advanced filtration
  • Membrane filtration
  • Reverse osmosis
  • UV disinfection
  • Anaerobic digestion
  • Nitrification
  • Biological denitrification
  • Membrane bioreactor systems

Industrial Process and Wastewater Treatment & Reuse

  • Environmental impact assessment

Environmental Engineering and Consultancy

slide-7
SLIDE 7

Market Size: Waste Management

  • Report on Infrastructure in India by the Central government’s High Powered Expert Committee projected an

investment of US$ 771.65 billion over 20 years from 2011-12 Capital expenditure

  • A. Investment for unmet demand

2.24

  • B. Investment for additional demand

3.33

  • C. Investment required for replacement

3.99 9.56 Operation and maintenance (O&M) 53.92 Total 63.48 Capital and O&M requirement in municipal waste management sector in US$ billion (2030)

  • In same report, investment requirement for waste management conservatively estimated at US$ 9.56 billion
  • Report also estimates additional requirement of US$ 391.73 billion for general O&M cost (2030)
  • Cost for O&M in municipal solid waste management assessed at US$ 53.9 billion (2030)
  • By 2030 India’s waste management market projected to be worth US$ 18 billion at US$ 15 per capita
slide-8
SLIDE 8

Potential Sectors: Waste Management

  • Waste handling equipment
  • Gasification, pyrolysis and incineration technologies
  • Waste treatment technologies
  • Waste management systems design expertise
  • Landfill design and engineering
  • Brownfield site remediation design and equipment
  • Soil contamination testing and monitoring equipment

Solid Waste, E-waste and Hazardous & Medical Waste

slide-9
SLIDE 9

Market Size: Waste-to-Energy

  • India’s potential to generate energy from waste was approximately 956 MW in 2017
  • Estimated to increase to 2.2 GW by 2030
  • By 2052, total waste-to-energy generation potential in India estimated at approximately 5.4 GW
  • Of this, about 5% has been harnessed as in 2017
  • Waste to energy market estimated at US$ 1.5 billion (2017)
slide-10
SLIDE 10

Potential Sectors: Waste-to-Energy

  • Direct combustion

Thermal

  • Gasification
  • Pyrolysis
  • Liquefaction
  • Plasma-techno

Thermo Chemical

  • Pulverizing and drying

Mechanical and Thermal

  • Fermentation
  • Anaerobic digestion

Biochemical

slide-11
SLIDE 11

Government and Official Organizations

  • Ministry of Environment, Forest and Climate Change
  • Ministry of Water Resources, River Development and

Ganga Rejuvenation

  • Ministry of Drinking Water and Sanitation
  • Ministry of Housing and Urban Affairs
  • Ministry of Finance

Central Government Ministries

  • Central Pollution Control Board
  • State Pollution Control Boards (SPCBs)
  • Pollution Control Committees (PCCs)
  • State Urban Development Departments
  • Department of Economic Affairs
  • Niti Aayog
  • National Institute of Urban Affairs

Institutions/Organizations

slide-12
SLIDE 12
  • Wildlife (Protection) Act 1972
  • Forests (Conservation Act) 1980
  • Environment Protection Act 1986
  • Biological Diversity Act 2002

Wildlife and Forests

  • Water (Prevention and Control of Pollution) Act

1974

  • Water (Prevention and Control of Pollution) Cess

Act 1977 Water and Waste Water

  • Municipal Solid Waste (Management and Handling)

Rules, 2000

  • Bio-Medical Waste (Management and Handling)

Rules, 2003

  • Batteries (Management and Handling) Rules, 2001
  • Hazardous Wastes (Management, Handling and

Transboundary Movement) Rules, 2008

  • Plastic Waste (Management and Handling) Rules,

2011

  • E- Waste (Management and Handling) Rules, 2011

Waste Management

  • Air (Prevention and Control of Pollution) Act 1981

Air

  • National Renewable Energy Act 2015

Renewable Energy

Official Environmental Acts and Rules

  • Noise Pollution (Regulation and Control) Rules, 2000

Noise

slide-13
SLIDE 13
  • Advising Central government
  • Coordinating activities of State Pollution

Control Boards

  • Organizing programs
  • Setting standards
  • Collecting, compiling and publishing data
  • Preparing manuals
  • Establishing laboratories

Central Pollution Control Board (CPCB) State Pollution Control Board (SPCB)

  • Advising State government
  • Setting standards
  • Obtaining

information, surveying and sampling, keeping records, sanctioning/ refusing permissions

  • Authorizing representatives to enter, inspect

and examine or conducting searches

  • Re-structuring pollutant outlets
  • Suggesting efficient methods

Functions of Pollution Control Boards

slide-14
SLIDE 14

Smart Cities Mission

  • 5-year program (2017-2022) launched by the central Ministry of Housing and Urban Affairs in June 2015

with results expected post-2022.

  • Total cost of projects (April 2018): US$ 31 billion
  • Each city to create a Special Purpose Vehicle (SPV) for implementation to which Central and State

Governments will contribute US$ 75 million each

  • 99 cities selected in 5 rounds (January 2018) based on Smart Cities Challenge. Current status:

Round 1: 51% of the projects in cities selected have been tendered or under implementation Round 2 and 3: Nearly all the cities have set up SPVs Round 4 and 5: Under various stages of planning

  • Since the launch of the mission, US$ 1.5 billion has been released by the Central government
  • 753 projects worth US$ 3.8 billion have been completed or started work on-ground
  • About 287 projects worth US$ 2.2 billion are in tendering stage and the works on-ground are expected to

start very soon

slide-15
SLIDE 15

AMRUT Mission

  • Total outlay for Central government mission estimated at US$ 7.7 billion
  • Launched in June 2015 with focus of urban renewal projects to establish infrastructure ensuring adequate

sewage networks and water supply, transportation, green spaces/parks, capacity building for ULBs

  • Central Ministry of Housing and Urban Affairs responsible for mission implementation, in collaboration

with the State governments of the respective selected cities

  • Scheme dependent on public private partnership model (PPP) model. Possible to link local state schemes

related to water supply and sewerage as also Swachh Bharat Mission to AMRUT

  • 500 cities proposed to be covered which include all State capitals, cities with over 100’000 population,

heritage cities, tourist destinations, hill stations/islands, etc.

slide-16
SLIDE 16

Swachh Bharat Abhiyan - Clean India Mission

  • 2. Swachh Bharat Abhiyan - Gramin (Rural) of the Ministry of Drinking Water and Sanitation

Key components:

  • Start-up activities
  • Information education and communication and public awareness
  • Capacity building and administration
  • Construction of individual house-hold toilets (IHHL)
  • Availability of sanitation material through rural sanitary mart, production centers, etc.
  • Provision of revolving fund in the district and micro financing of construction of toilets;
  • Community sanitary complex
  • Solid and liquid waste management (SLWM)
  • 1. Swachh Bharat Abhiyan - Urban of the Ministry of Housing and Urban Affairs.

Key components:

  • Individual house-hold latrines(IHHL)
  • Community toilets
  • Public toilets
  • Solid waste management
  • Information education and communication and public awareness
  • Capacity building and administration

The Clean Indian Mission contains two sub-missions:

slide-17
SLIDE 17

Corporate Social Responsibility

  • Corporate Social Responsibility (CSR) Rules outlined in the Companies Act of 2013 and came into

effect on 1 April 2014

  • However, the mandate of spending 2% of net profit on CSR initiatives is only “recommendatory” and

not a statutory obligation

  • Applies to firms with a net worth of at least US$ 83.5 million or revenue of US$ 167 million or net

profit of US$ 833’500

  • Such companies should spend 2% of their average profit in the last three years on social

development-related activities such as sanitation, education, healthcare and poverty alleviation, etc.

  • Any failure in this regard to be explained in the annual financial statement; this disclosure

requirement is meant to ensure firms “do their best” in CSR initiatives

slide-18
SLIDE 18

Challenges and Hurdles

Challenges

  • Properly assessing the potential of your India market
  • Planning a long-term, sustainable business strategy for

a price sensitive market like India

  • Adapting existing technologies to local conditions
  • Understanding existing Central and State government

incentives, policies, laws, etc.

  • Identifying challenges related to scale and different

trading and cultural environments

  • Recognizing issues related to differences in standards,

testing and certifications

  • Instituting a suitable local presence
  • Dealing with fragmentation of the market across

regions

  • Establishing first local pilot project
  • Keeping up with established and new competitors
  • Bureaucracy and red tape
  • Price sensitivity and planning local price points to

remain competitive

  • Transparency in tenders
  • High tariffs and multiplicity of taxes at Central, State

and city levels

  • Corruption
  • Constant changes and revision in policy
  • Limited sophistication of local partners
  • Legal and contractual obligations
  • Logistics and infrastructure bottlenecks

Hurdles

slide-19
SLIDE 19

Ashwin Merchant

34-B Sleater Road | Mumbai 400007 | +91 22 2386 8113 | +91 98213 11123 | ashmerchant@gmail.com

Thank you

India: A Ready Market for Swiss Environmental Technology SME’s

Fachhochschule Nordwestschweiz (FHNW), 5210 Windisch Wednesday, 18 April 2018