
SLIDE 1
1
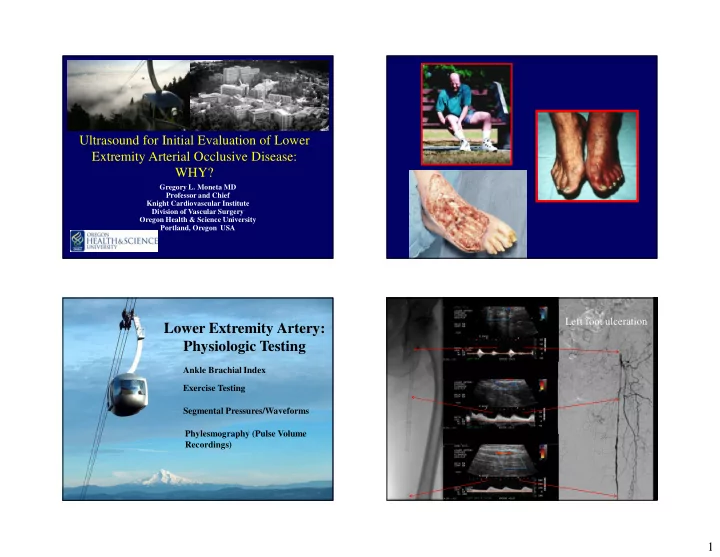
Master Title Ultrasound for Initial Evaluation of Lower Extremity Arterial Occlusive Disease: WHY?
Gregory L. Moneta MD Professor and Chief Knight Cardiovascular Institute Division of Vascular Surgery Oregon Health & Science University Portland, Oregon USA