
SLIDE 1
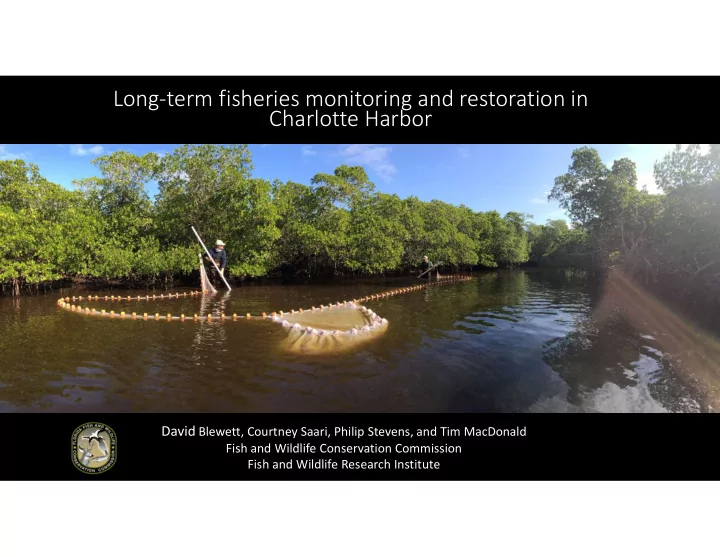
Long-term fisheries monitoring and restoration in Charlotte Harbor
David Blewett, Courtney Saari, Philip Stevens, and Tim MacDonald
Fish and Wildlife Conservation Commission Fish and Wildlife Research Institute
Long-term fisheries monitoring and restoration in Charlotte Harbor - - PowerPoint PPT Presentation
Long-term fisheries monitoring and restoration in Charlotte Harbor David Blewett, Courtney Saari, Philip Stevens, and Tim MacDonald Fish and Wildlife Conservation Commission Fish and Wildlife Research Institute FWC Fisheries-Independent
Fish and Wildlife Conservation Commission Fish and Wildlife Research Institute
Northern Indian River Lagoon 1990 Southern Indian River Lagoon 1997 Florida Keys 1998 Charlotte Harbor 1989 Tampa Bay 1989 Cedar Key 1996 Apalachicola 1997
2001 Choctawhatchee Bay & Santa Rosa Sound 1992 - 1997 Charlotte Harbor crew
Random sampling design Over 100 sampling sites per month Record data on all fishes and selected invertebrates, habitat, and physio- chemical conditions *Over 50 published studies in the last 10 years
Shallow bay sets (flats and shorelines) Deep bay and river (>1.7 m) Rivers and tidal creeks
Photo by Jamie Darrow
Pre- and post- disturbance
Grant funding for the Blind Pass reopening project helped to increase our sampling efforts in and around Blind Pass
Historic Seine Samples (20 years of data)
Developed a sampling program to collect larger juvenile snook in Charlotte Harbor to aid Snook Stock Assessment needs – 2014 (extended our river seine sampling to creeks)
Adding age-1 snook abundance to compliment our adult snook data and to add a predictive measure for estimating stocks in the future
Catfish Creek Whidden Creek
Phase 2 Phase 1
Rotonda
Phase 3
Coral Creek
Two reference creeks
Coral Creek Restoration Sampling
ANOSIM R=0.33; P=0.001
MDS plot - circles represent 56% similarity
Catfish Whidden Lower-Coral East-Coral West-Coral
2D Stress: 0
Differences in fish assemblages – 2 distinct groups emerge
East-Coral, Catfish, and Whidden - more Rainwater Killifish, Silversides, Goldspotted Killifish, Pink Shrimp Lower- and West-Coral - more Bay Anchovy, Tidewater Mojarra, Clown Goby, Silver Jenny, Striped Mojarra, Redfin Needlefish SIMPER
Peace River Myakka River
Charlotte Harbor
Alligator Two Pines Bear Yucca Pens Durden Winegourd Zemel Silcox (north and south) Study Creeks = Yellow Reference Creeks = Blue Great potential for doing a pre- and post- restoration study along the eastern shoreline Collect baseline fisheries, habitat, and water condition data Possibly six creeks impacted by the Flatwoods Hydrological Restoration
Alligator Two Pines Bear Yucca Pens Durden Winegourd Zemel Silcox (north and south) Study Creeks = Yellow Reference Creeks = Blue
Uneven monthly sampling effort in the all other tidal creeks (10 samples per zone, 3 zones) Sampling in Alligator Creek is similar to our rivers (4 samples per month)
Creeks Study/ Reference January February March April May June July August September October November December FIM Total Alligator (mainstem) Study 2 2 2 2 2 2 2 2 2 2 2 2 24 Alligator (tributaries)Study 2 2 2 2 2 2 2 2 2 2 2 2 24 Zemel Canal Study 3 2 1 1 1 2 3 3 1 17 Bear Branch Study 1 1 1 2 2 1 2 1 1 1 1 14 Yucca Pens Study 1 1 1 4 1 3 2 2 2 2 19 Durden Study 2 1 1 1 1 2 1 2 1 2 14 Two Pines Study 2 2 2 1 2 2 3 3 1 1 2 21 North Silcox Reference 1 1 1 2 1 4 1 11 South Silcox Reference 2 1 3 Winegourd Reference 2 1 1 1 5 Total 14 11 12 15 11 10 11 14 14 15 12 13 152
Number of seine samples Tidal Creek Study/ Reference State Funded Grant Funded Total Number Alligator (mainstem) Study 24 24 Alligator (tributaries) Study 24 24 Zemel Canal Study 13 11 24 Bear Branch Study 14 10 24 Yucca Pens Study 16 8 24 Durden Study 14 10 24 Two Pines Study 19 5 24 North Silcox Reference 9 15 24 South Silcox Reference 3 21 24 Winegourd Reference 5 19 24
Also, uniform quarterly sampling may be another option to explore, which could bring grant costs down even further
Juvenile Redfish are more abundant in Myakka Cutoff creeks and in the Peace and Myakka rivers (Red) Whereas, juvenile Snook are more abundant in Cape Haze and Southeast Wall creeks (Blue) Myakka Cutoff West Wall Alligator Creek NE Wall SE Wall E Cape Haze W Cape Peace River Myakka River W Cape Haze
Young-of-the-Year (10-99 mm SL)
Region
M y a k k a P e a c e M C u t
f A l l i g a t
W W a l l N E S E E C a p e W C a p e
Mean abundance (fish/100m2)
1 2 3 4
(100-300 mm SL)
Region
M y a k k a P e a c e M C u t
f A l l i g a t
W W a l l N E S E E C a p e W C a p e 1 2 3
Common Snook
Young-of-the-Year (10-99 mm SL)
Region
M y a k k a P e a c e M C u t
f A l l i g a t
W W a l l N E S E E C a p e W C a p e
Mean abundance (fish/100m2)
1 2 3 4 5 6 7
(100-300 mm SL)
Region
M y a k k a P e a c e M C u t
f A l l i g a t
W W a l l N E S E E C a p e W C a p e 0.00 0.05 0.10 0.15
Red Drum
Rivers Gulf passes Rivers Gulf passes