
Lognormal distribution of subjects by income XL5A-V0H 2014-Schield-LogNormal-Income1-Excel2013-Slides.pdf 1
2014 Schield Log-Normal Income1XL5A: 0H 1
Milo Schield
Augsburg College Editor: www.StatLit.org US Rep: International Statistical Literacy Project
Output, slides and data at www.StatLit.org/ pdf/Excel2013-Schield-LogNormal-Income1-Demo.pdf pdf/Excel2013-Schield-LogNormal-Income1-Slides.pdf Excel/Excel2013-Schield-LogNormal-Income1-Data.xlsx
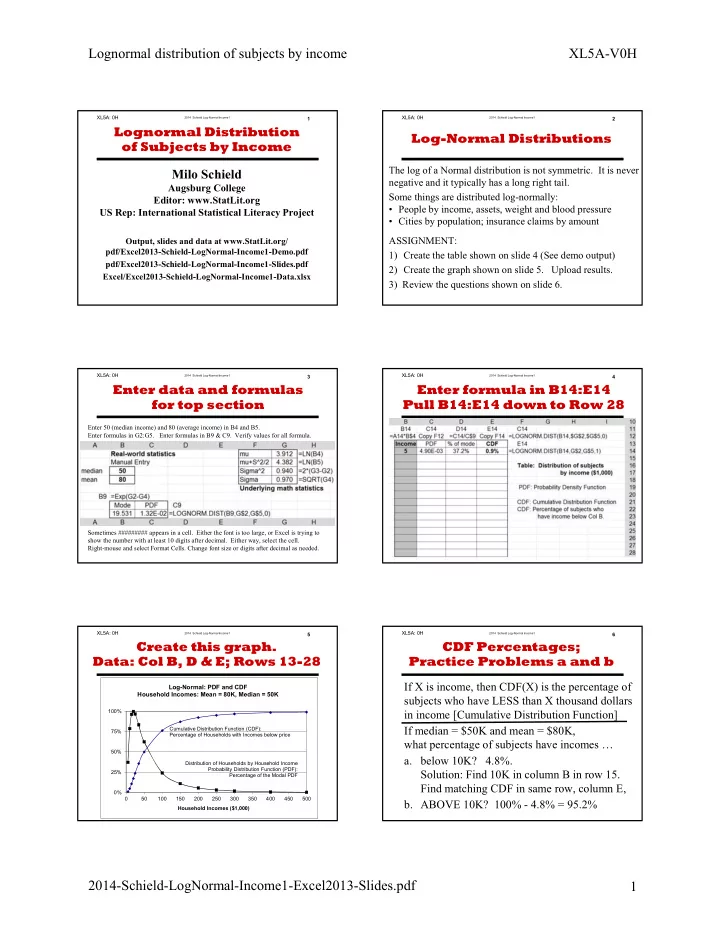
Lognormal Distribution
- f Subjects by Income
XL5A: 0H 2
The log of a Normal distribution is not symmetric. It is never negative and it typically has a long right tail. Some things are distributed log-normally:
- People by income, assets, weight and blood pressure
- Cities by population; insurance claims by amount
ASSIGNMENT: 1) Create the table shown on slide 4 (See demo output) 2) Create the graph shown on slide 5. Upload results. 3) Review the questions shown on slide 6.
Log-Normal Distributions
2014 Schield Log-Normal Income1XL5A: 0H 3
Enter 50 (median income) and 80 (average income) in B4 and B5. Enter formulas in G2:G5. Enter formulas in B9 & C9. Verify values for all formula. Sometimes ######### appears in a cell. Either the font is too large, or Excel is trying to show the number with at least 10 digits after decimal. Either way, select the cell. Right-mouse and select Format Cells. Change font size or digits after decimal as needed.
Enter data and formulas for top section
2014 Schield Log-Normal Income1XL5A: 0H 4
.
Enter formula in B14:E14 Pull B14:E14 down to Row 28
2014 Schield Log-Normal Income1XL5A: 0H 5
.
Create this graph. Data: Col B, D & E; Rows 13-28
0% 25% 50% 75% 100% 50 100 150 200 250 300 350 400 450 500 Household Incomes ($1,000)
Log-Normal: PDF and CDF Household Incomes: Mean = 80K, Median = 50K
Distribution of Households by Household Income Probability Distribution Function (PDF): Percentage of the Modal PDF Cumulative Distribution Function (CDF): Percentage of Households with Incomes below price
2014 Schield Log-Normal Income1XL5A: 0H 6
If X is income, then CDF(X) is the percentage of subjects who have LESS than X thousand dollars in income [Cumulative Distribution Function] If median = $50K and mean = $80K, what percentage of subjects have incomes …
- a. below 10K? 4.8%.
Solution: Find 10K in column B in row 15. Find matching CDF in same row, column E,
- b. ABOVE 10K? 100% - 4.8% = 95.2%
CDF Percentages; Practice Problems a and b