
Sandia National Laboratories is a multi-program laboratory managed and operated by Sandia Corporation, a wholly owned subsidiary of Lockheed Martin Corporation, for the U.S. Department of Energy’s National Nuclear Security Administration under contract DE- AC04-94AL85000.
Photos placed in horizontal position with even amount of white space between photos and header
Local ¡search ¡to ¡improve ¡task ¡mapping ¡
Balzuweit*, ¡Bunde*, ¡Vitus ¡ ¡Leung, ¡Finley*, ¡Lee* ¡
P2S2, ¡12 ¡September ¡2014 ¡ ¡
*Knox ¡College, ¡Galesburg, ¡IL ¡
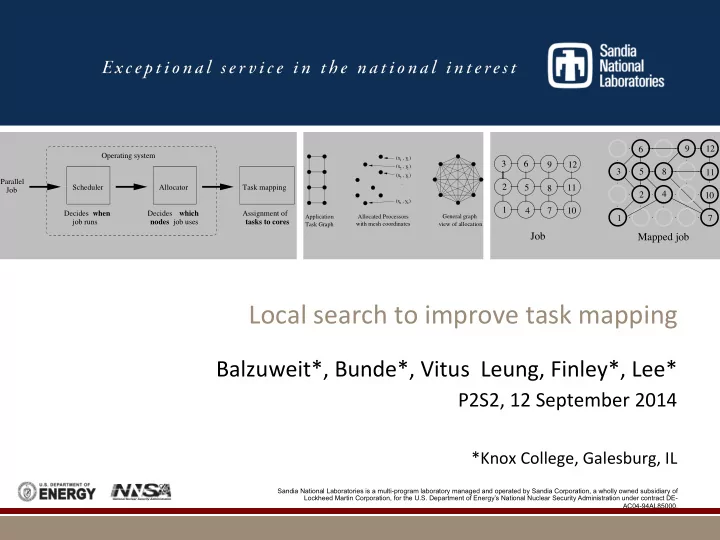
job runs Allocator which Decides nodes job uses Task mapping Assignment of tasks to cores Scheduler when Decides Parallel Job Operating system
(x , y ) (x , y ) (x , y ) (x , y )
General graph view of allocation with mesh coordinates Allocated Processors Application Task Graph
. . .
2 3 n 2 3 1 1 n9 5 6 7 8 12 1 3 5 6 9 12 4 2 8 11 10 7
Job
10
Mapped job
11 1 2 3 4