livestock and
play

Livestock and 28 US Land Grant Universities: 7 USDA Agencies : AMS - PDF document

Jim Robb, LMIC 11/28/17 Livestock and 28 US Land Grant Universities: 7 USDA Agencies : AMS (Market News), APIS, Feedgrain Outlook ERS, GIPSA (Packers & Stock.), NASS, FAS, and WAOB 12 Associate Members: 2017 Range Beef Cow Symposium


  1. Jim Robb, LMIC 11/28/17 Livestock and 28 US Land Grant Universities: 7 USDA Agencies : AMS (Market News), APIS, Feedgrain Outlook ERS, GIPSA (Packers & Stock.), NASS, FAS, and WAOB 12 Associate Members: 2017 Range Beef Cow Symposium AFBF ASI November 28-30, 2017 NCBA NPB CME-Group Canadian Consortium Noble Research Institute CoBank James G. Robb TCFA Director, LMIC TCU NWFCS USDA Data Sources -- NASS, AMS, FAS, Website: www.lmic.info DLR and ERS Forecasts By -- LMIC SLAUGHTER STEER PRICES Topics: Outlook and Economic Drivers …. 5 Market Weighted Average, Weekly $ Per Cwt. 150 • Cattle Prices and LMIC’s Forecasts Through 2019 • Corn Price Outlook 140 • Total U.S. Red Meat and Poultry Production 130 • Dimensions of Demand and The Marketing Chain • Beef International Trade 120 • Cattle -- Cyclical Aspects and Returns • Marketing, Managing, and Financing 110 • Some Really Long Term Stuff 100 90 JAN APR JUL OCT Avg. 2011-15 2016 2017 Data Source: USDA-AMS SLAUGHTER COW PRICES MED. & LRG. #1 STEER CALF PRICES Southern Plains, 85-90% Lean, Weekly 500-600 Pounds, Southern Plains, Weekly $ Per Cwt. $ Per Cwt. 100 220 210 90 200 190 80 180 170 70 160 150 60 140 130 50 120 JAN APR JUL OCT JAN APR JUL OCT Avg. 2011-15 2016 2017 Avg. 2011-15 2016 2017 Data Source: USDA-AMS Data Source: USDA-AMS 2017 Range Beef Cow Symposium, Cheyenne, Wyo. 1
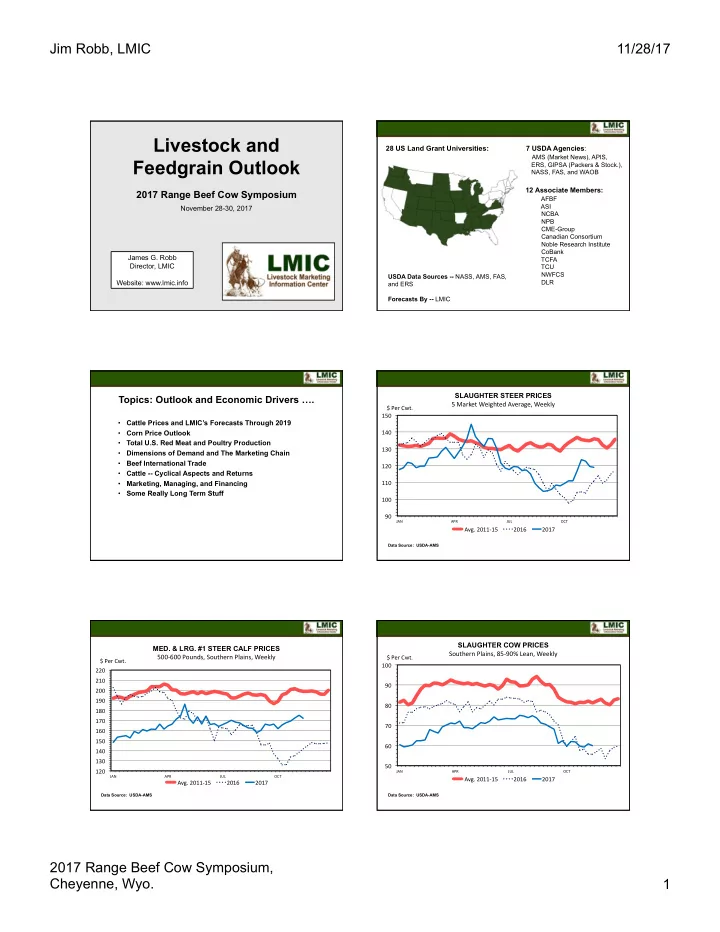
  2. Jim Robb, LMIC 11/28/17 STEER DRESSED WEIGHT AVERAGE ANNUAL CATTLE PRICES Federally Inspected, Weekly Southern Plains Pounds $ Per Cwt 940 275 250 920 225 900 200 175 880 150 860 125 100 840 75 820 50 JAN APR JUL OCT 1990 1992 1994 1996 1998 2000 2002 2004 2006 2008 2010 2012 2014 2016 2018 Avg. 2011-15 2016 2017 500-600lb Steer Calves 700-800lb Feeder Steers Fed Steers Data Source: USDA-AMS & USDA-NASS Data Source: USDA-AMS, Compiled and Forecasts by LMIC Year S. Plains Quarter 5-600# AVERAGE CALF PRICES ($/Cwt) 500-600lb Steer Calves, Southern Plains 2016 Domestic Consumer $ Per Cwt I 195.73 300 II 173.86 Demand and .... III 157.12 275 IV 138.44 Year 166.29 250 2017 225 I 157.38 II 170.49 200 III 165.47 IV b 166-168 175 Year 164-166 2018 150 I c 161-165 125 II 161-166 III 154-160 100 IV 147-154 Year 155-161 75 2019 2003 2004 2005 2006 2007 2008 2009 2010 2011 2012 2013 2014 2015 2016 2017 2018 2019 I 150-158 Annual Average 4th Quarter II 151-160 III 148-158 IV 143-154 Data Source: USDA-AMS, Compiled and Forecasts by LMIC Year 149-157 Domestic U.S. Consumer Confidence US BEEF CONSUMPTION Monthly, Index year 1966 = 100 Per Capita, Retail Weight, Annual Index Pounds 120 70 110 100 65 90 60 80 70 55 60 50 1978 1981 1984 1987 1990 1993 1996 1999 2002 2005 2008 2011 2014 2017 50 1994 1996 1998 2000 2002 2004 2006 2008 2010 2012 2014 2016 2018 Data Source: Thomson Reuters/University of Michigan Data Source: USDA-NASS, Compiled & Analysis by LMIC 2017 Range Beef Cow Symposium, Cheyenne, Wyo. 2

  3. Jim Robb, LMIC 11/28/17 RETAIL ALL FRESH BEEF DEMAND INDEX LIVE TO CUTOUT BEEF PRICE SPREAD Third Quarter, Using CPI 1990=100 Monthly Index Value $ Per 1000 lbs 120 440 100 390 99 100 93 88 89 92 87 83 83 78 74 75 76 78 79 91 89 86 84 86 340 75 73 75 77 82 82 83 85 80 290 240 60 190 40 140 90 20 40 JAN FEB MAR APR MAY JUN JUL AUG SEP OCT NOV DEC 0 Avg. 2011-15 2016 2017 1990 1992 1994 1996 1998 2000 2002 2004 2006 2008 2010 2012 2014 2016 Data Source: Bureau of Labor Statistics, USDA-ERS, Compiled & Analysis by LMIC Data Source: USDA-AMS & USDA-ERS, Compiled & Analysis by LMIC CUTOUT TO RETAIL BEEF PRICE SPREAD Monthly $ Per 1000 lbs Pork, Chicken, 1400 Etc. 1350 1300 1250 1200 1150 1100 1050 1000 950 900 Jan Feb Mar Apr May Jun Jul Aug Sep Oct Nov Dec Avg. 2011-15 2016 2017 Data Source: USDA-AMS & USDA-ERS, Compiled & Analysis by LMIC COMMERCIAL PORK PRODUCTION US PORK EXPORTS Carcass Weight, Monthly US, Quarterly Mil. Pounds Bil. Pounds 550 7.5 525 7.0 500 475 6.5 450 6.0 425 400 5.5 375 5.0 350 JAN-MAR APR-JUN JUL-SEP OCT-DEC JAN FEB MAR APR MAY JUN JUL AUG SEP OCT NOV DEC Avg. 2012/16 2017 2018 2019 Avg. 2011-15 2016 2017 Data Source: USDA-NASS, Forecasts by LMIC Data Source: USDA-ERS & USDA-FAS 2017 Range Beef Cow Symposium, Cheyenne, Wyo. 3

  4. Jim Robb, LMIC 11/28/17 RTC BROILER PRODUCTION US BROILER EXPORTS US, Quarterly RTC Weight, Monthly Mil. Pounds Bil. Pounds 650 11.5 630 11.0 610 590 10.5 570 550 10.0 530 9.5 510 490 9.0 470 8.5 450 JAN-MAR APR-JUN JUL-SEP OCT-DEC JAN FEB MAR APR MAY JUN JUL AUG SEP OCT NOV DEC Avg. 2012/16 2017 2018 2019 Avg. 2011-15 2016 2017 Data Source: USDA-NASS, Forecasts by LMIC Data Source: USDA-ERS & USDA-FAS TOTAL RED MEAT & POULTRY PRODUCTION US, Quarterly Beef Exports Bil. Pounds 27.5 and Imports 27.0 2018 26.5 Annual Per 26.0 Person Dis. 25.5 218.7 Lb. 25.0 Retail. 24.5 Largest 24.0 Since 2007 23.5 23.0 22.5 22.0 21.5 JAN-MAR APR-JUN JUL-SEP OCT-DEC Avg. 2012/16 2017 2018 2019 Data Source: USDA-NASS, Forecasts by LMIC 41/57 = 72% since1960 US BEEF AND VEAL EXPORTS US BEEF AND VEAL EXPORTS Carcass Weight, Monthly Carcass Weight, Annual Mil. Pounds Bil. Pounds 275 3.5 3.0 250 2.5 225 2.0 200 1.5 175 1.0 0.5 150 JAN FEB MAR APR MAY JUN JUL AUG SEP OCT NOV DEC 0.0 Avg. 2011-15 2016 2017 1994 1997 2000 2003 2006 2009 2012 2015 2018 Data Source: USDA-ERS & USDA-FAS Data Source: USDA-ERS & USDA-FAS 2017 Range Beef Cow Symposium, Cheyenne, Wyo. 4

  5. Jim Robb, LMIC 11/28/17 US BEEF AND VEAL IMPORTS Carcass Weight, Annual Bil. Pounds Feedgrains 4.0 -- Corn 3.5 3.0 2.5 2.0 1.5 1994 1997 2000 2003 2006 2009 2012 2015 2018 Data Source: USDA-ERS & USDA-FAS US CORN DISAPPEARANCE AND STOCKS US TOTAL CORN SUPPLY AND PRICE Crop Year Crop Year Bil. Bushels Bil. Bushels $ Per Bushel 18.0 18 8.00 16.0 16 7.00 14.0 14 6.00 12.0 12 5.00 10.0 8.0 10 4.00 6.0 8 3.00 4.0 6 2.00 2.0 0.0 4 1.00 1993 1995 1997 1999 2001 2003 2005 2007 2009 2011 2013 2015 2017 1993 1995 1997 1999 2001 2003 2005 2007 2009 2011 2013 2015 2017 Feed & Residual Food, Seed & Industrial Exports Stocks Supply Price Data Source: USDA-NASS and ERS, Forecasts by LMIC Data Source: USDA-NASS, Compiled & Forecasts by LMIC NATIONAL AVERAGE CORN YIELD Crop Year Bu. Per Acre Cattle 180 170 160 150 140 130 120 110 100 90 1993 1995 1997 1999 2001 2003 2005 2007 2009 2011 2013 2015 2017 Data Source: USDA-NASS, Forecasts by LMIC 155 Bu Per Acre $4.70/Bu 2017 Range Beef Cow Symposium, Cheyenne, Wyo. 5

  6. Jim Robb, LMIC 11/28/17 TOTAL CATTLE INVENTORY BY CYCLE CALF CROP U.S., January 1 July Es`mates, U.S., Annual Mil. Head Mil. Head 41 140 130 40 120 39 2017 = 36.3 Million Head 110 +3.5 Percent 38 100 37 90 36 80 35 70 34 60 0 1 2 3 4 5 6 7 8 9 10 11 12 13 14 1938-49 1949-58 1958-67 1967-79 33 1979-90 1990-04 2004-14 2014-17 1987 1990 1993 1996 1999 2002 2005 2008 2011 2014 2017 Data Source: USDA-NASS Data Source: USDA-NASS BEEF COW SLAUGHTER HEIFER SLAUGHTER Federally Inspected, Weekly Federally Inspected, Weekly Thou. Head Thou. Head 70 200 190 65 180 60 170 55 160 50 150 140 45 130 40 120 35 110 30 100 JAN APR JUL OCT JAN APR JUL OCT Avg. 2011-15 2016 2017 Avg. 2011-15 2016 2017 Data Source: USDA-AMS & USDA-NASS Data Source: USDA-AMS & USDA-NASS JANUARY 1 TOTAL CATTLE INVENTORY COMMERCIAL BEEF PRODUCTION U.S., Annual US, Quarterly Mil. Head Bil. Pounds 140 7.5 7.3 2018 130 7.1 Annual Per 6.9 Person Dis. 120 57.8 Lb. 6.7 Retail. 6.5 Largest 110 6.3 Since 2010 6.1 100 5.9 5.7 90 5.5 JAN-MAR APR-JUN JUL-SEP OCT-DEC 80 Avg. 2012/16 2017 2018 2019 2017 = 26.2 Billion 1957 1962 1967 1972 1977 1982 1987 1992 1997 2002 2007 2012 2017 2018 = 27.3 Billion Data Source: USDA-NASS; Forecasts by LMIC Data Source: USDA-NASS, Forecasts by LMIC 2019 = 27.9 Billion 2017 Range Beef Cow Symposium, Cheyenne, Wyo. 6

Download Presentation
Download Policy: The content available on the website is offered to you 'AS IS' for your personal information and use only. It cannot be commercialized, licensed, or distributed on other websites without prior consent from the author. To download a presentation, simply click this link. If you encounter any difficulties during the download process, it's possible that the publisher has removed the file from their server.

Recommend


More recommend