Farms, Trees and Carbon Workshop Agriculture and climate change - - PDF document

farms trees and carbon workshop
SMART_READER_LITE
LIVE PREVIEW

Farms, Trees and Carbon Workshop Agriculture and climate change - - PDF document

04/04/2019 Farms, Trees and Carbon Workshop Agriculture and climate change Where do livestock emissions come from Livestock are neither a direct source nor a store of CO 2 Livestock are a source of methane ( CH 4 ), which eventually


slide-1
SLIDE 1

04/04/2019 1

Farms, Trees and Carbon Workshop

Where do livestock emissions come from

CO2 CO2 CO2

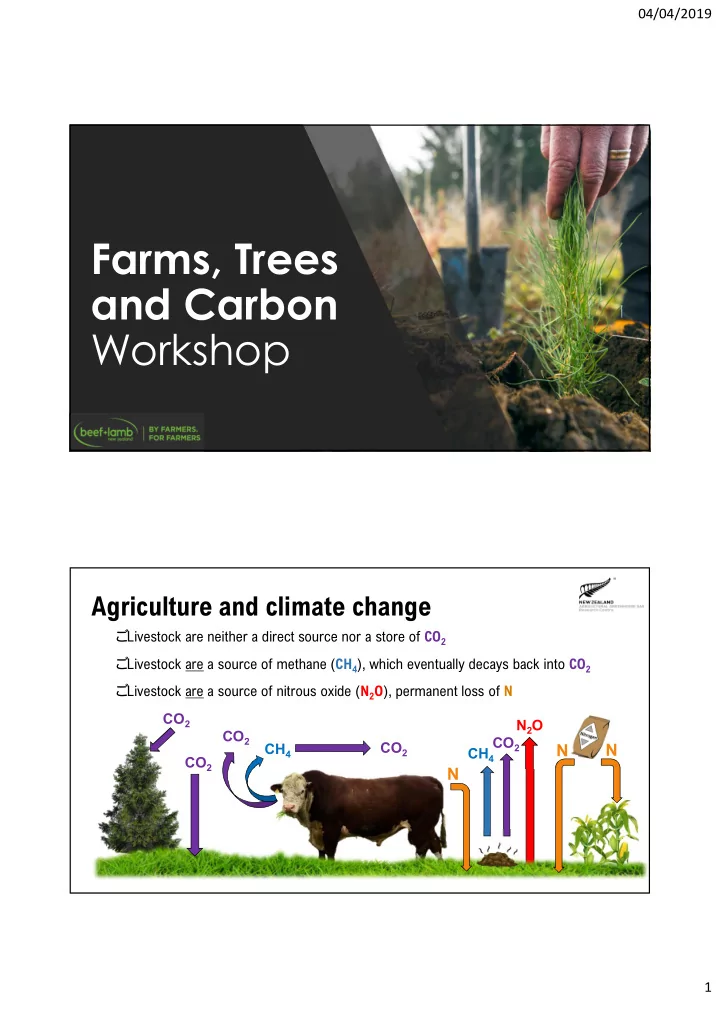
  • Livestock are neither a direct source nor a store of CO2
  • Livestock are a source of methane (CH4), which eventually decays back into CO2
  • Livestock are a source of nitrous oxide (N2O), permanent loss of N

CH4 CO2 N2O

N

Agriculture and climate change

CH4 CO2

N N

slide-2
SLIDE 2

04/04/2019 2

What can farmers do?

Keep getting the most out of your farm Use resources more efficiently to increase outputs:

Improve stock genetics Improve pasture quality + feed utilisation Improve animal health Lower stocking rates GROW TREES income,

  • Incr. biodiversity,

shade & shelter, reduce sediment, store carbon farm emission offset Get Farm level report on your farm emissions

Pole plantings Plantation Forestry Riparian/stock exclusion Indigenous/retired

ETS - Compliments good land use decisions

Right species… Right place

slide-3
SLIDE 3

04/04/2019 3

_ _ _ _ _ _ _ _ _ _ _ _ _ _ _ _ 1 January 1990 31 December 1989 Became ‘forest land’ from 1 Jan 1990

“Post-1989”

Was ‘forest land’ at 31 Dec 1989 and predominantly EXOTIC in 2008

“Pre-1990”

Baseline date - Kyoto

can apply for ‘Offset’ to new location

  • r change of land use / not forest

land for longer than 4 years

Pre-1990 Deforestation

2 hectares or more deforested (change of land use) by the same entity, within legal boundary, within 5 year compliance periods. (eg: 2013 – 2017) Obligation = surrender of units equivalent to carbon released Penalty if not notified in time = up to $30 to MPI and $30 to EPA per unit

slide-4
SLIDE 4

04/04/2019 4

  • NZ’s Domestic carbon market designed to reduce total carbon emissions
  • Voluntary participation (Post-1989 land)
  • 5 year compliance periods i.e. 2008 – 2012… 2013 – 2017… 2018 – 2022
  • Gain carbon units based on increase of carbon in a calendar year
  • Pinus radiata (regional), Hardwood, Softwood, Indigenous, Douglas Fir
  • Over 100 hectares registered (FMA) must measure actual carbon present

NZ Emissions Trading Scheme Carbon - Species Comparison

slide-5
SLIDE 5

04/04/2019 5

Carbon – Exotic Regimes

10 20 30 40 50 60 70 80

1 2 3 4 5 6 7 8 9 10 11 12 13 14 15 16 17 18 19 20 21 22 23 24 25 26 27 28 29 30 31 32 33 34 35

tonnes carbon/ha/year Age of trees Trees thinned

UNTHINNED THINNED MPI Standard Tables

Enduring Carbon Opportunity - Current

‘low’ risk’ / enduring carbon

Enduring ‘low risk’ carbon The lowest point of total carbon when replanted – multiple rotations Depends on age felled and year replanted Must have claimed years 1-10 of the 1st crop

slide-6
SLIDE 6

04/04/2019 6

Averaging Accounting approach = the average total carbon across rotations Harvested Wood Products (HWP)

  • Add increase to carbon

tables or

  • Create an “industry

good” fund to develop longer lived HWP Permanent Post-1989

  • Like a Permanent Forest

Sink (50yrs)

  • Not capped at average

Average total carbon

ETS Review / Consultation

20m 4m 20m 4m 15m

  • Narrow varieties = Less canopy
  • New poles - Max 4m buffer but 20m on perimeter

poles

  • Younger poles need higher stems per hectare (SPH)
  • Mature trees eligible based on drip line (max 15m to

edge)

Spaced plantings - ETS eligibility tips

20m 15m max

max

slide-7
SLIDE 7

04/04/2019 7

  • Survival …. Location and spacing crucial (monitor & replant)
  • Assess >30% canopy cover potential well met
  • Irregular shapes…. Link / increase existing poles
  • Use to buffer narrow / riparian areas
  • Determine age - Establishment records (evidence)
  • Over 100 ha (FMA) measure actual carbon present (less)

Spaced/Riparian plantings - tips

Other exotic Hardwoods

YEARs 1 - 5 6 – 10 11 -15 16 - 20 21 - 25 26 - 30 NZU for 5 year period 63 188 158 117 92 67 NZU TOTAL accrued 63 251 409 526 618 685

  • Peak growth per hectare in years 6 - 10
  • Annual growth plateaus around years 20 - 25 onwards

Potential carbon

Source: MPI standard Look-up tables

slide-8
SLIDE 8

04/04/2019 8

Pole plantings Solution: Link existing pole plantings to create 26 ETS eligible Ha Riparian and stock exclusion areas Solution - plant:

  • Poles outside fenced area to create 30m avg
  • Pollen producing trees
  • Hives and carbon opportunities

Radiata Solution …Right species right place:

  • Plant 45 Ha pine

Mature Indigenous Forest

Farm Example

483 ha Northland

Emissions 2018 3,460 (3,444 SU = 1.005 CO2e per SU) 1990 Running similar numbers Target 11% below 1990 Target is 3,114 CO2e Reduction required of 346 units

Farm Emission Profile Example

Plant 45 Ha Pine Average of 812 NZU/year Plant 26 Ha Poplar Average of 594 NZU/year Stream plantings Average of 80 NZU/year Total NZU opportunity 1,486 NZU/year (+180..from SU reduction) 1,666 reduction achieved – 346 reduction required

slide-9
SLIDE 9

04/04/2019 9 48% Emission reduction below 1990 levels

  • Reduced sediment run off
  • Increased pollination services from year round hive placement
  • Increased bird life/other biodiversity
  • At a loss of 180 SU
  • $253,800 revenue

Farm Net Benefit (30 years)

30 Year Revenue Hive rental $150,000 39,600 NZU (@ $25/NZU) $999,000 Tree harvest revenues $1,175,895 Sub-total $2,324,895 Less stock unit revenue $253,800 Total $2,071,095

  • Farm story and web site
  • ‘Land environmental plan’(LEP) species placement

and selection

  • Carbon profile…past present and future
  • Funding applications
  • ETS applications
  • Succession planning /exit strategy

How is this useful?