
SLIDE 1
Fraunhofer
ISI Institute Systems and Innovation Research
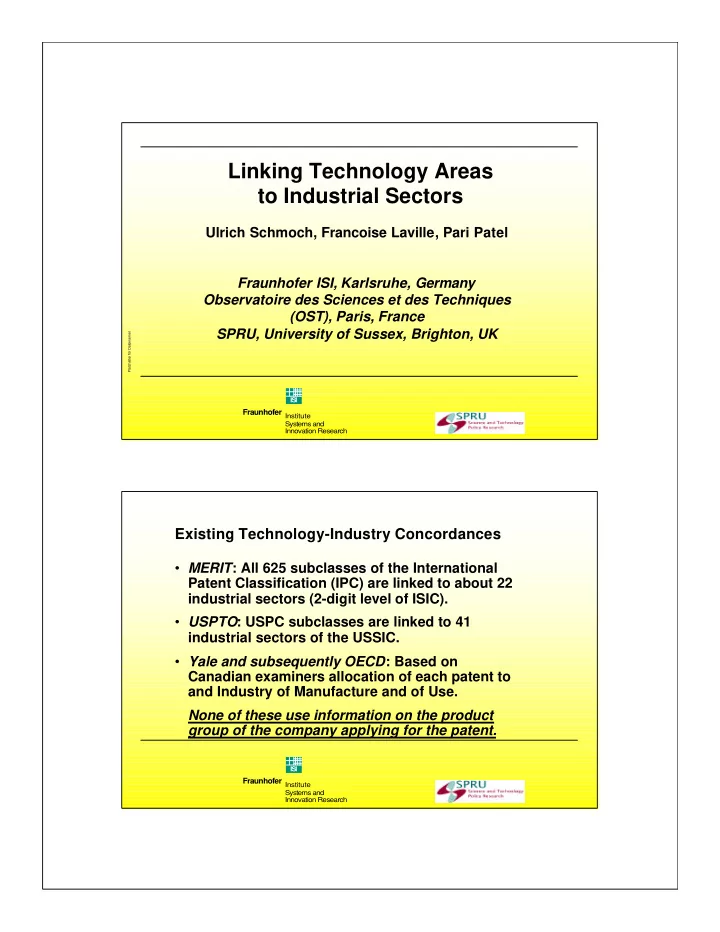
Linking Technology Areas to Industrial Sectors
Ulrich Schmoch, Francoise Laville, Pari Patel Fraunhofer ISI, Karlsruhe, Germany Observatoire des Sciences et des Techniques (OST), Paris, France SPRU, University of Sussex, Brighton, UK
Platzhalter für Dateinamen
Fraunhofer
ISI Institute Systems and Innovation Research
Existing Technology-Industry Concordances
- MERIT: All 625 subclasses of the International
Patent Classification (IPC) are linked to about 22 industrial sectors (2-digit level of ISIC).
- USPTO: USPC subclasses are linked to 41
industrial sectors of the USSIC.
- Yale and subsequently OECD: Based on