
SLIDE 1
Linear growth via diversified businesses Businesses building scale - - PowerPoint PPT Presentation
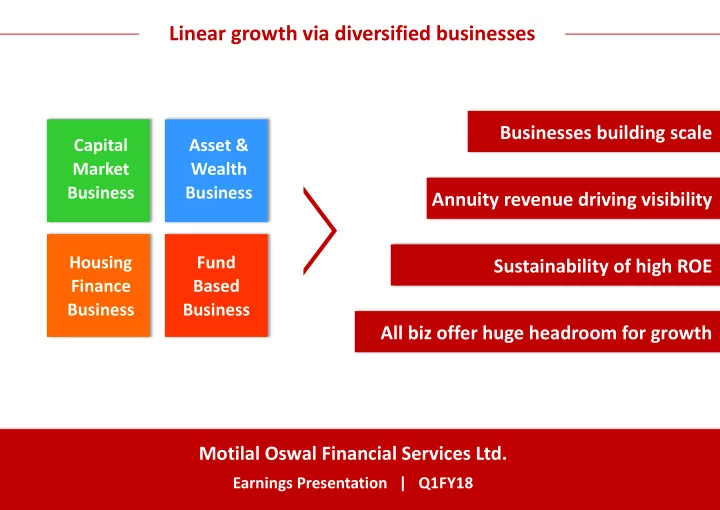
Linear growth via diversified businesses Businesses building scale Capital Asset & Market Wealth Business Business Annuity revenue driving visibility Housing Fund Sustainability of high ROE Finance Based Business Business All biz
Healthy volume growth; Maintained high-yield Cash market share
3
Concluded 5 transactions in Q1FY18; deal pipeline remains robust
Capital Market Business Asset & Wealth Business Housing Finance Business Fund Based Business
Strong growth of 147% YoY in Distribution AUM Rs 52bn Highest quarterly Broking Revenue AMC Net Sales Rs 29bn, +231% YoY, AUM Rs 250 bn, +104% YoY Increase in Market share of Net sales from 4% in Q1FY17 to 4.6% in Q1FY18 IBEF-I valuation at ~3.7x Performance fee to continue on exit Present in 9 states now; 120 Branches in Q1FY18
Lower average ticket size at Rs 0.9mn in Q1FY18 vs Rs 1mn in Q1FY17 Maintained NIM at ~4% and spread of ~3.5% Unrealized gain on MF investments Rs 3.6 bn not included in P/L PAT While reported ROE was~22% whereas including unrealized gains, then it would be ~26% XIRR of 24% on our MF investments in line with Value PMS track-record* Continues to be in investment mode - higher manpower cost, +80% YoY Maintaining a healthy ~1% net yield in AMC biz Wealth AUM Rs 113 bn, +53% YoY; Healthy pace
Loan book growth remains robust at Rs 43bn, +73% YoY
* See Disclaimer in Asset Management slide All AUM figures are for Q1FY18, unless otherwise mentioned
4
* RoE calculated on Average Networth
# Treasury gains in Agency business P&L has been classified under Fund Based & Net carry earned on PE exits shown under Asset & Wealth Management
Does not include unrealized gain on our MF investments (Rs 3.6 bn as of June 2017). Post-tax XIRR of these investments (since inception) of ~24%; Other treasury investments are valued at cost
Segment-wise ROE* with % of Net Worth Employed
Capital Markets#
(10% of NW Emp) Asset & Wealth Mgt&
(5% of NW Emp) Housing Finance
(38% of NW Emp) Fund Based@
(47% of NW Emp) MOFSL Consolidated
(100% of NW Emp)
Group ROE
Capital Markets#
(11% of NW Emp) Asset & Wealth Mgt&
(5% of NW Emp) Housing Finance
(29% of NW Emp) Fund Based@
(55% of NW Emp) MOFSL Consolidated
(100% of NW Emp)
6
Note: From 1st Apr’17, MOFSL has changed its accounting policy for ESOP valuation from intrinsic value to fair value method. This change is applied retrospectively. Accordingly, expense of Rs. 161.3 mn has been debited to the P&L of Q1FY18 and the PBT is lower to that extent for the current quarter. Had the company continued to use the earlier method of accounting PBT would have been higher by Rs. 161.3 mn for Q1FY18.
7
Consolidated revenue +58% YoY, led by the Capital market business +53% YoY, Asset & wealth management business +102% YoY, and Housing finance business +60% YoY.
comprised 56% of revenues in Q1FY18 vs. 49% in the same period last year. Profit for the quarter stood at Rs 1bn +28% YoY. This highest ever quarterly profit was contributed by all businesses.
business (+87% YoY). Ad expenses are +128% YoY in AMC business. In case of HFC business, branches are up by 94% YoY, Manpower cost is up by 80% YoY. These up fronted investments will translate into operating leverage, going forward.
value to fair value. Excluding this impact, PBT would have been higher by 46% YoY.
& Wealth management is 154%, Capital market is72% and Housing finance is 8%.
Unrealised gain in AU Small Finance bank (listed recently) was Rs 1.8 bn (based on last closing price)
investments
Revenues: All businesses, led by AMC, capital market & HFC, led the growth in Q1FY18
8 PAT: Fund based, AMC & Capital Market contributed significantly, HFC remains in investing phase
9
Retail Broking & Distribution Institutional Equities Investment Banking Asset Management Private Equity Wealth Management
Asset & Wealth Businesses
Sponsor commitments to
NBFC LAS book
Fund Based Business Capital Market Businesses
Housing Finance
11
12
60% YoY. Overall broking business has registered highest ever quarterly revenue in Q1FY18.
~20% of the distribution network tapped, we expect meaningful increase in AUM & fee income as cross-sell increases
& institution was up 40%.
YoY basis, and overall market share was 1.8% in Q1FY18. Blended yield has improved from 3.1bps in Q1FY17 to 3.2bps in Q1FY18
margin stands at 16% in Q1FY18. However, the full benefit of operating leverage is yet to unfold. Distribution AUM picked up strongly to Rs 52bn, +147% YoY Healthy volume growth, maintained market share in the high-yield cash segment Highest quarterly broking revenue Ample scope for
domestic business and blocks. Institutional clients were 638, +6% YoY.
in rank in almost every account led by focused and broad-based team servicing.
share.
biz volumes.
interest.
AUM mark (+147% YoY).
efforts to drive revenue growth supported by a bull market
from online sources
along with new franchisee addition
digitization.
(Click here) which is an investment product which helps in meeting an individual's personal & financial goals, this is receiving positive initial response among all distributors and branches.
13
Distribution Assets (Rs Bn) Depository Assets (Rs Bn)
Bank , GTPL Hathaway and PSP projects
in the market
Among the top 10 investment banks in primary market equity deal ranking in H1CY17 Completed 5 transactions in Q1FY18 Healthy pipeline of deals and accelerated pace of execution
14
Retail Broking & Distribution Institutional Equities Investment Banking Asset Management Private Equity Wealth Management
Asset & Wealth Businesses
Sponsor commitments to
NBFC LAS book
Fund Based Business Capital Market Businesses
Housing Finance
15
128bn PMS AUM
brand-recall.
advertising/marketing have been upfronted, which could result in a meaningful operating leverage in the future
business
16
*Rank includes our AUM in Equity MF, PMS & AIF; Industry AUM includes Equity MF assets excl Arbitrage funds **Includes only Open-Ended Equity Mutual Funds
AMC AUM Rs 250 bn in Q1FY18 104% YoY AMC Net Sales Rs 29 bn in Q1F18 231% YoY Rank in Equity AUM* 9 in June 2017
~4.6% in Net Flows ~2.2% in Avg AUM
17
* Read above fund performances with their corresponding Disclaimers in the funds’ Fact Sheets, which are available in www.motilaloswalmf.com.
are helping us to garner higher market share.
14 years). F-35, our largest MF scheme by AUM, delivered absolute returns of 31.4% and alpha over benchmark of 16.2%, since inception.
considerable interest. This bodes well in increasing higher participation from distributor and investor fraternity.
MF AUM Market Share should converge towards MF Net Sales Market Share eventually Alpha generation across MOAMC Strategies * (Performance since inception)
1 Inception Date: 25/03/2003. These returns are of a Model Client as on 31st Mar 2017. Returns of individual
clients may differ depending on time of entry in the strategy. Past performance may or may not be sustained in future and should not be used as a basis for comparison with other investments. Returns shown are post fees and
(INR). It is likely to deliver a gross multiple of ~3.7X. This implies that nearly half of the estimated profits are yet to be booked
corpus of Rs 6-7 bn.
FY17 consolidated results of the PE-entities. Exceptional Item includes revenue from share in profit on sale of investments (carry share) made in the 1st PE growth fund
Real Estate Funds show significant scalability IBEF I exits could result in lumpy gains in FY18-FY19
18
Total AUM of PE business stands at Rs 32bn
Rs 113 bn.
Deepening our client wallet-share & RM productivity
19
Wealth AUM Rs 113 bn in Q1FY18 53% YoY Client Families 41% YoY Wealth net sales sequentially remained stable at ~Rs 4bn
AMC AUM Rs 250 bn in Q1FY18 104% YoY
~4.6% in Net Flows ~2.2% in Avg AUM AMC Net Sales Rs 29 bn in Q1F18 231% YoY Distribution AUM picked up strongly to Rs 52bn, +147% YoY Healthy volume growth, maintained market share in the high-yield cash segment Highest quarterly broking revenue
Click Here Click here
Ad spends were Rs 46 mn in Q1FY18, +128% YoY, Won Best Performing National Financial Advisor Equity Broker' award
20
Retail Broking & Distribution Institutional Equities Investment Banking Asset Management Private Equity Wealth Management
Asset & Wealth Businesses
Sponsor commitments to
NBFC LAS book
Fund Based Business Capital Market Businesses
Housing Finance
21
Continue to invest in manpower and technology Gearing remains conservative
22
Loan extended to more than ~48000 families
46% HFC Loan Book Rs 43 bn in Q1FY18 +73% YoY
23
postponement of customer decision and builders adopting wait and watch approach. Also, after a very strong Q4, management consciously decided to utilise this quarter to make investments in systems and processes that will help achieve a bigger scale. Our outlook of disbursement growth remains positive, enabled by a significantly expanded state and branch footprint.
affordable housing segment besides seasoning of Aspire’s loan book.
fund was mainly on account of no incremental funding raised via CP instruments. However, its impact on margin was limited as incremental net borrowing was significantly lower than Q4FY17.
lines & NCD were allotted to 24 institutions, as of June 2017. These were 23 and 22 respectively in June 2016.
lower profitability coupled with equity dilution led by promoter capital infusion of Rs 1bn during the quarter.
despite healthy loan book growth. This expansion is expected to yield results in FY18
These include new apps for sales, credit, collection, clients and vendors.
490 mn we have received in this quarter only.
(Ministry of Housing and Urban Poverty Alleviation)”
24
Retail Broking & Distribution Institutional Equities Investment Banking Asset Management Private Equity Wealth Management
Asset & Wealth Businesses
Sponsor commitments to
NBFC LAS book
Fund Based Business Capital Market Businesses
Housing Finance
25
if required
been included, ROE would have been ~31%, much higher than what was reported
performance track record of our QGLP investment philosophy (Value PMS scheme has delivered 25% CAGR* in 14 years)
Exceptional items includes share in profit on sale of investments (carry share) made in the 1st PE growth fund, as well as the impact of a write-off on account of doubtful NPA
MOFSL Standalone
* Inception Date: 25/03/2003. These returns are of a Model Client as on 31st Mar 2017. Returns of individual clients may differ depending on time of entry in the strategy. Past performance may or may not be sustained in future and should not be used as a basis for comparison with other investments. Returns shown are post fees and expenses. Benchmark is Nifty 50 Index
Investments in MOAMC mutual funds (at cost): Rs 6.4 bn Unrealized gain on MF investments: Rs 3.6 bn (not included in P/L) Investments in MO PE/RE funds (at cost): Rs 2.5 bn Exits from 1st PE fund led to portfolio gains of Rs 0.3 bn in FY17
26
28 Higher allocation to financial assets signifying opportunity for MFs Equity assets are rising in recent years
Source: RBI
Low penetration of MFs provides headroom for growth
MF penetration (AUM/GDP%); Global AUM ($Tn)
Source: RBI Source: RBI Source: Bloomberg, IIFA Report
Equities are underpenetrated within Indian financial assets
29
Source: AMFI
Market performance drives MF net flows, a repeat of the last cycle (Rs bn)
Source: AMFI
The last up-cycle from FY02-08 saw a significant spike in Equity MF AUM; It has again seen rapid traction from FY14 onwards (Rs tn) Proportion of Equity in Industry MF AUM mix went up in 5 years
Source: AMFI
Investor A/Cs (Mn) in MF industry took off since mid-2014
Source: AMFI Source: AMFI
India is home to ~0.2 mn HNIs, out of which ~0.15 mn are UHNIs; UHNI growth and count has seen steady growth last 6 years
Source: Kotak Top of Pyramid Report
30 Individual Wealth distribution shows India has a higher share
Source: Karvy Wealth report, 2016 Source: AMFI
HNI’s mutual funds AUM grew at 25% CAGR in the last 4 years (Rs bn); Folios also picked up (Mn)
HNI’s equity mutual funds AUM have picked up at a higher CAGR of 50% in the last 4 years (Rs bn)
Source: AMFI
Source: ICRA Source: ICRA Source: ICRA Source: ICRA
Within the pure Housing-Only portfolio of all HFCs, that of Small HFCs has outpaced the other HFCs (Rs tn) Mortgage penetration rates (approx.) show India is still relatively underpenetrated vs its Asian peers HFCs share picked up as it grew at a faster pace than Banks India’s housing credit market grew significantly recently (Rs tn) 31
Source: NSE, BSE
Proportion of retail volumes in the cash volume picked up this quarter Market ADTO picked up this quarter in the F&O segment (Rs bn)
Source: NSE
Proportion of NSE cash volumes consolidated to the largest brokers during bull-phases in the markets, not bear-periods
Source: NSE, BSE
32
Source: NSE
DIIs record lower net inflows in FY17, after a strong run rate seen in FY16 (Rs bn) As momentum in IPO activity continued, incremental demat accounts continued to grow at a healthy pace
Source: NSE, BSE
FIIs maintains net inflows in Q1FY18 (Rs bn) IPO raising has picked up since the last 2 years; FY17 has also seen higher-value IPOs which is a positive sign
Source: Prime Source: CDSL, NSDL
33
looking statements are tentative, based on current analysis and anticipation of the management of MOFSL. Actual results may vary from the forward-looking statements contained in this presentations due to various risks and uncertainties involved. These risks and uncertainties include volatility in the securities market, economic and political conditions, new regulations, government policies and volatility in interest rates that may impact the businesses of
estimates, although its accuracy can not be guaranteed. MOFSL undertakes no obligation to update forward-looking statements to reflect events or circumstances after the date thereof.
by you on the basis of the information contained herein is your responsibility alone and MOFSL and its subsidiaries or its employees or directors, associates will not be liable in any manner for the consequences of such action taken by you. We have exercised due diligence in checking the correctness and authenticity of the information contained herein, but do not represent that it is accurate or complete. MOFSL or any of its subsidiaries or associates or employees shall not be in any way responsible for any loss or damage that may arise to any person from any inadvertent error in the information contained in this publication. The recipient of this report should rely on their own investigations. MOFSL and/or its subsidiaries and/or directors, employees or associates may have interests or positions, financial or otherwise in the securities mentioned in this report.
Contact: Shalibhadra Shah Chief Financial Officer Motilal Oswal Financial Services Limited Tel: 91-22-39825500 / 91-22-33124917 Email: shalibhadrashah@motilaloswal.com Rakesh Shinde VP–Investor Relations Motilal Oswal Financial Services Limited Tel: 91-22-39825500 / 91-22-39825510 Email: rakesh.shinde@motilaloswal.com