
SLIDE 1
1
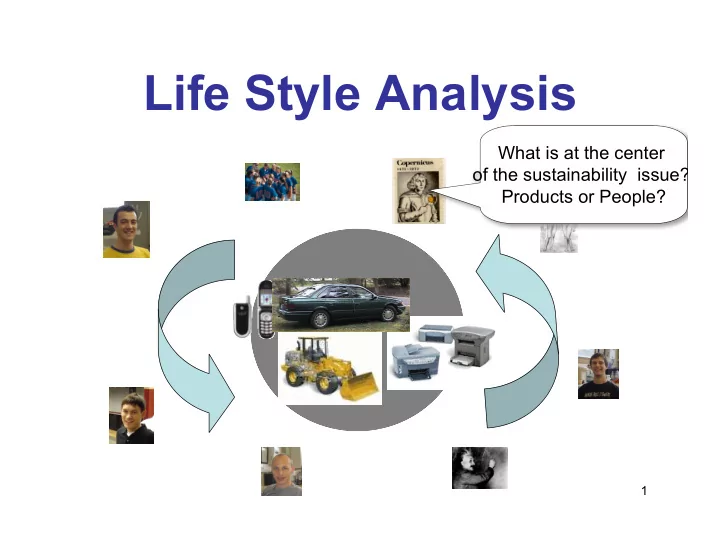
Life Style Analysis
What is at the center
- f the sustainability issue?
Products or People?
Life Style Analysis What is at the center of the sustainability - - PowerPoint PPT Presentation
Life Style Analysis What is at the center of the sustainability issue? Products or People? 1 Start with a product or service, Where does the coffee come from? Where was it roasted? Where did the paper cup come from?
1
What is at the center
Products or People?
2
coffee come from?
roasted?
cup come from?
How was this stuff made, and Oh, how did you get to Starbuck’s?
food, drinks, bottled water, air trips, car, bus, clothes, books, paper, heating fuel, tuition, medicines, furniture, cleaning services, clothes washing, A/C, cell phone, ipod, laptop, skis, tennis racket……
4
Timothy Gutowski, Amanda Taplett, Anna Allen, Amy Banzaert, Rob Cirinciore, Christopher Cleaver, Stacy Figueredo, Susan Fredholm, Betar Gallant, Alissa Jones, Jonathan Krones, Barry Kudrowitz, Cynthia Lin, Alfredo Morales, David Quinn, Megan Roberts, Robert Scaringe, Tim Studley, Sittha Sukkasi, Mika Tomczak, Jessica Vechakul, and Malima Wolf. IEEE International Symposium on Electronics
and the Environment, San Francisco, May 19 – 21, 2008
http://web.mit.edu/ebm/www/Publications/ELSA%20IEEE%202008.pdf
5
Note possible double counting
6
(i = diet, clothing etc.)
impact ”j” per dollar spent in sector “i”
ij i i j
7
D is the fraction of dollars spent in
life style sector “i” (i = diet, clothing etc.)
impact ”j” per dollar spent in sector “i”
ij i D i ij i i j
8
I i ij ij i D i D i j j
in Impact Change in Total Amount Spent Change in Spending Category, fraction
Dollars Change in Impact Coefficient fraction
Impact
GROWTH
CONSUMER CHOICE INDUSTRY COEFICIENT
9
10
11
12
08 . 000 , 5 000 , 5 400 , 5 =
P
5
1 1
. A A e e =
P e e
for ΔΙ≤0 you want Δ e/e ≥ΔP/P
13
1. Food, Restaurant, Alcohol (preparation in Utilities) 2. Housing, Purchase, Maintenance (financing in Services) 3. Clothing, Jewelry, Cleaning, Repair (wash and dry in Utilities) 4. Utilities (electricity, water, sewer, fuels used, trash)
Note possible double counting
14
Note possible double counting
15
16
(vegetarian student in a cooperative)
2.83 project, 2007 Jessica Vechakul
17
18
19
(2 variants) 1000-8000 $1-1.7M $2.3M Pro Golfer
(3 variants) 3700 $950k $1M U.S. Senator
(3 variants) 2500 $680k Coma Patient
(3 variants) 600 $210k $200k Investment Banker
estimate 500 $90k Nursing Home Patient
some interviews 500 $90k $80k Manage Consultant
interviewed 480 $70k $45k Commercial Artist
composite 270 $92k $58k Engineer
interviewed 180 $50k $11k
interviewed (3) 250-400 $40k-$50k $35k Teach for America
some interviews 400 $73k $75k Soccer Mom
estimated 130 $19k Five year old
some interviews 300 $94k $27k Retired person
composite 125 $20k $7k Homeless person
interviewed 290 $25k $21k Buddhist Monk I
interviewed 120 $13k $8.5k Buddhist Monk II
Expenditure
21
1. grow food 2. process food 3. prepare 5. waste 4. eat
hothouse, transported a long distance etc. Is the person a vegetarian or carnivore. How is the food prepared? Do you prepare your own food? Do you eat out? Do they compost their waste food products or throw them away? See Smil p 56-63, p 129-133, see FAO, Pimm
22
3. wear 5. waste 4. wash
do they repair or replace it, are they fashion conscious and have a large wardrobe or do they wear the same thing every day, Do they wash and dry their clothes using hot water or cold water, are the clothes ironed, dry cleaned, line dried, etc. Are the used clothes recycled or thrown away? See “Well Dressed?” Julian Allwood, U Cambridge, Mfg Inst. 2006
23
3. Use 5. waste 4. Repair
with special emphasis on automobiles and air travel,also included charter air travel as well as other modes such as bicycling and walking. Are carbon offsets used? See Smil p 139-149, HLM, Ch 6
24
3. Use 5. waste 4. Repair Housing. Do you rent or own? Where is the house located and what is the climate? Is the house large, small, new or old, repairs etc. Multiple houses? Do you heat and cool your home(s) while you are not in them? What fuels are used? These have to be calculated separately. Potential overlap with utilities. Financial aspects of housing can be important.
25
3. Use 5. waste 4. Repair Utilities: Water, sewerage, electricity. How do you generate your electricity? Gas, oil, coal, hydro-electric, nuclear, wing, photovoltaic? This will vary by location, or use national average. There are Utilities sectors in the CMU/EIO model.
26
3. Use 5. waste 4. Repair Household Appliances. This includes the refrigerators, washers, dryers, freezers, hot water heaters, toaster oven, fans, coffee maker, lighting and so forth. Also electronics, computers, TV, plasma screens, gameboys, charging cell phones… Note the overlap with Utilities and Housing. Don’t double count
27
Idle (Watts) In Use (Watts) Lights # of bulbs watts per bulb Fixture 1, 4 x 40 watt bulbs 4 40 160 Fixture 2, 2 x 60 watt bulbs 2 60 120 Fixture 3, 2 x 40 watt bulbs 2 40 80 Fixture 4, 1 x 60 watt bulb 1 60 60 Fixture 5, 1 x 11 watt bulb 1 11 11 Fixture 6, 1 x 25 watt bulb 1 25 25 Fans, etc Portable Air Cleaner Electric 50 Desk Fan 30 Floor Fan 30 Cleaning Clotheswasher 269.2 Clothes dryer 4500 Iron 1100 Vaccuum 650 Hand-Held Electric Vacuum 300 Hygiene Men's Shaver 1.4 15 Women's Shaver 1.4 15 Curling Iron 25 Hair Dryer 710 Hand Held Massager 15 Heating Pads 60 Default Values*
28
Kitchen Can Opener 100 Blender 300 Juicer 125 Hand Mixers 150 Stand Mixers 100 Auto Coffee Maker 70 1500 Espresso Maker 360 Hot Plate 1250 Electric Stove Burner 1250 Electric Kettle 1500 Microwave 3.1 1500 Air Corn Popper 1400 Hot Oil Corn Popper 575 Slow Cooker 200 Electric grill 1800 Waffle Iron/Sandwhich Grill 1200 Dishwasher 694 Refrigerator 6.1 571 Entertainment Audio Stand-alone Boom Box 2.2 4.8 Mini-System 9.4 34 Clock Radio 1.7 8.3
29
Audio Components (add together as appropriate) Amplifier 1.4 31 Cassette Deck 2.7 2 CD Player 3.1 16 DVD Player 4.5 20 Equalizer 3.1 52 Power Speaker 4.6 5.8 Preamp/Tuner 2.4 18 Rack 3.2 6.2 Receiver 1.8 6.7 Tuner 2 6.2 Video Games 2 20 Color TV 4 77 Projection Color TV 2.2 150 Satellite Earth Station 14.9 15 Cable Boxes 11.6 20 Rechargeable Toy/Game 2.2 Miscellaneous Cell Phone Charger 8.6 8.6 Cordless Phone 1.1 1.1 Cordless Power Tool 0.63 0.63 Multi-Purpose Battery Charger 0.2 0.2 * Values from LBNL
30
3. Use 5. waste 4. Repair
your direct expenditures they may constitute ~16% to 35% (see Kudrowitz and Allen, and “What We Work For”) The basic areas are: Health Care, Education, Entertainment, Recreation, Legal. .
31
3. Use 5. waste 4. Repair Insurance, Pensions etc. Payments to these sectors can be quite large for middle income and upper income people. Ex., Home financing, retirement benefits and employer matching benefits, interest on accrued benefits, 401 K, stocks, bonds,
and have associated environmental impacts.
32
3. Use 5. waste 4. Repair Government: All the services you get for paying your taxes to State, Federal and Local governments. This ranges from roads, police, fire courts, health organizations, social security, military on and on…
33
34
Lifestyle Homeless CA 5-year-old Income 4,176 $ 5,500 $ Food 57% 45% Food - Home 0% 95% Food - Out 100% 5% Comments Mixed diet Mixed diet Housing 0% 0% Description Emergency Shelter Single family, CA urban suburban Electric Bill
Utilities 0% 8% Apparel 4% 12% Clothing 20% 95% Leather/Fur 0% 0% Jewelry 0% 0% Other - Shoes 0% 5% Cleaning 80% 0% Cleaning - Home 0% 100% Cleaning - Dry 0% 0% Cleaning - Other 100% 0% Transportation 22% 15% # of cars
Services 17% 21% Financial 0% 0% Total (check) 100% 100%
35
Income Data by Lifestyle
1 10 100 1,000 10,000 100,000 1,000,000 10,000,000 100,000,000 1,000,000,000 10,000,000,000 C h i l d C
a
i x H
e l e s s N u r s i n g H
e V e g S t u d e n t T F A
h i c a g
F A
Y C E n g i n e e r M g m t C
s u l t a n t G
f e r
i g h C E O " A v e r a g e " O p r a h Lifestyle Dollars Disposable Income Annual Expenditures Effective Income Calculation Govt Services
36
Energy Use vs. Disposable Income 1 10 100 1,000 10,000 100,000 1,000,000 10,000,000 100,000,000 1,000,000,000 10,000,000,000 1 10 100 1,000 10,000 100,00 1,000, 000 10,000 ,000 100,00 0,000 1,000, 000,000 10,000 ,000,00 Disposable Income ($) Energy Use (MJ) Energy (MJ) Energy (MJ) less I&I
37
Carbon Dioxide Emissions 1.00 10.00 100.00 1,000.00 10,000.00 100,000.00 1,000,000.00 1 10 100 1,000 10,000 100,00 1,000,0 00 10,000, 000 100,00 0,000 1,000,0 00,000 10,000, 000,000 Disposable Income ($) CO2 Emissions (MT CO2E) CO2 (MT) CO2 (MT) less I&I
38
39
Global Warming Potential vs. Disposable Income 1.00E+00 1.00E+01 1.00E+02 1.00E+03 1.00E+04 1.00E+05 1.00E+06 1.00E+0 1.00E+0 1 1.00E+0 2 1.00E+0 3 1.00E+0 4 1.00E+0 5 1.00E+0 6 1.00E+0 7 1.00E+0 8 1.00E+0 9 1.00E+1 Disposable Income ($) GWP (MT CO2E) GWP (MT CO2E) GWP (MT CO2E) less I&I
40
Total Toxic Releases 1.00 10.00 100.00 1,000.00 10,000.00 100,000.00 1,000,000.00 1 10 100 1,000 10,000 100,00 1,000, 000 10,000 ,000 100,00 0,000 1,000, 000,000 10,000 ,000,00 Disposable Income ($) Toxic Releases (kg) Total Toxic (KG) Total Toxic (KG) less I&I
41
Economic Impact of Activity 1 10 100 1,000 10,000 100,000 1,000,000 10,000,000 100,000,000 1,000,000,000 10,000,000,000 1 10 100 1,000 10,000 100,00 1,000, 000 10,000 ,000 100,00 0,000 1,000, 000,00 10,000 ,000,00 Disposable Income ($) Economic Activity ($)
Econ Activity ($) less I&I
42
0.10 0.15 0.45 1.42 Standard Dev 0.4 0.6 1.2 9.1 Mean 0.39 0.54 1.03 8.1 Gates 0.52 0.59 1.08 9.0 Oprah 0.44 0.56 1.00 8.3 CEO "Great" 0.42 0.55 0.98 8.2 CEO "Average" 0.43 0.38 0.75 9.5 Golfer - High 0.42 1.08 2.14 9.7 Golfer - Low 0.46 0.68 1.61 10.2 Inv Banker 0.28 0.50 0.82 7.4 Mgmt Consultant 0.35 0.54 1.08 8.1 Soccer Mom 0.38 0.58 1.13 8.6 Engineer 0.41 0.63 1.27 9.4 Artist 0.47 0.71 1.65 10.7 TFA - NYC 0.35 0.57 1.21 8.6 TFA - Houston 0.30 0.52 0.94 7.8 TFA - Chicago 0.33 0.55 1.04 8.2 Retiree 0.37 0.62 1.19 9.3 Veg Student 0.49 0.74 1.68 11.1 Monk 1 0.20 0.50 0.59 7.3 Nursing Home 0.61 0.81 2.08 12.4 Monk 2 0.26 0.53 0.68 7.8 Homeless
0.49 0.76 1.91 11.5 Child
g/$ kgCO2/$ kgCO2E/$ MJ/$
Food, Diet, Alcohol
43
44
0.08 0.24 0.27 2.7 Tax, Government Services 0.04 0.10 0.13 1.5 Insurance and Investment 0.31 0.28 0.34 4.4 Services, Personal 0.51 1.46 1.61 25.3 Transportation 1.79 0.59 0.77 8.2 Apparel, Services 0.79 3.88 4.73 32.3 Home Utilities, Fuel 0.45 0.54 0.61 6.7 Housing, Furniture, Maintenance 0.40 0.61 1.23 9.1 Food, Diet, Alcohol Toxics (G/$) CO2 (KG/$) GWP (KG CO2E /$) Energy (MJ/$) Impact Intensity Mean
45
0.03 0.07 0.08 1.19 Tax, Government Services 0.02 0.04 0.08 0.68 Insurance and Investment 0.09 0.07 0.09 0.66 Services, Personal 0.57 0.98 1.09 14.17 Transportation 1.98 0.36 0.51 1.74 Apparel, Services 0.35 3.03 3.61 16.71 Home Utilities, Fuel 0.17 0.38 0.41 1.84 Housing, Furniture, Maintenance 0.10 0.15 0.45 1.42 Food, Diet, Alcohol Toxics (G/$) CO2 (KG/$) GWP (KG CO2E /$) Energy (MJ/$) Impact Intensity Standard Deviation
46
Mean Energy
0.0 10.0 20.0 30.0 40.0 50.0 60.0 Food, Diet, Alcohol Housing, Furniture, Maintenance Home Utilities, Fuel Apparel, Services Transportation Services, Personal Insurance and Investment Tax, Government Services Category Energy (MJ/$)
47
Mean CO2
0.00 1.00 2.00 3.00 4.00 5.00 6.00 7.00 8.00 Food, Diet, Alcohol Housing, Furniture, Maintenance Home Utilities, Fuel Apparel, Services Transportation Services, Personal Insurance and Investment Tax, Government Services Category CO2 (KG/$)
48
Mean Toxics
0.00 0.50 1.00 1.50 2.00 2.50 3.00 3.50 4.00 Food, Diet, Alcohol Housing, Furniture, Maintenance Home Utilities, Fuel Apparel, Services Transportation Services, Personal Insurance and Investment Tax, Government Services Category Toxics (G/$)
49
50
2.2 4,400 0.2 gov 20.2 $20,000 TOTAL 0.2 1,800 0.1 investments 2.4 4,000 0.6 services 5.7 3,800 1.5 transportation 0.6 1,000 0.6 apparel 4.7 1,200 3.9 utilities 2.7 5,400 0.5 housing 1.7 2,800 0.6 food TONS CO2 $$$ Kg CO2/$
51
U.S. Average CO2 = 20 metric tons per person, per year World Average CO2 = 4.5 U.S. Smallest CO2 = 8.5 (homeless person)
52
274,871.5 9 1.07 269,492.7 8 104.69 4,451.64 16.06 389.20 298.62 117.54 Gates 24,976.40 1.69 18,594.65 277.75 4,714.03 301.15 595.00 262.88 229.25 Oprah 9,603.07 1.00 3,872.14 900.05 690.52 389.24 242.16 3,279.67 228.29 CEO "Great" 920.63 1.00 203.52 130.15 134.53 48.29 55.61 288.39 59.14 CEO "Average " 73.50 0.91 11.15 11.32 8.21 2.92 10.05 23.07 5.85 Golfer - Low 571.97 0.93 25.18 226.62 150.83 11.40 19.83 127.29 9.88 Golfer - High 40.89 0.92 9.36 2.39 4.15 2.76 3.39 8.06 9.85 Inv Banker 37.34 0.94 1.49 1.74 2.18 3.18 6.79 12.46 8.58 Mgmt Consulta nt 29.66 0.94 5.53 1.45 12.86 1.10 4.33 2.29 1.15 Soccer Mom 20.73 0.94 5.47 0.99 5.15 0.72 4.13 0.35 2.98 Engineer 35.68 0.93 1.02 2.15 10.00 0.98 13.71 2.95 3.94 Artist 17.28 0.92 0.59 1.90 4.86 0.86 1.87 4.77 1.52 TFA - NYC 28.72 0.92 0.57 1.16 6.54 1.35 7.41 7.66 3.12 TFA - Houston 20.84 2.50 0.56 1.17 7.85 1.55 1.73 2.33 3.14 TFA - Chicago 26.20 4.41 6.21 1.35 2.32 0.19 8.84 0.48 2.39 Retiree 13.16 0.92 0.12 6.75 0.79 0.11 2.81 0.11 1.54 Veg Student 19.64 0.94 0.02 0.07 11.04 0.09 3.41 2.01 2.05 Monk 1 33.64 6.67 (0.03) 9.03 2.03 0.75 3.73 4.57 6.90 Nursing Home 10.49 0.93 0.05 0.09 5.57 0.07 2.97 0.22 0.60 Monk 2 8.47 4.22 (0.24) 0.18 0.30 0.08 0.03
Homeless 151.39 32.49 0.07 118.83
support 159.77 19.86 0.21 139.70
mix 176.18 0.91 0.07 175.20
ICU 9.61 3.03 0.07 0.13 0.18 0.54 4.51 0.21 0.95 Child Totals Tax, Govt Services Insurance and Investme nt Services, Personal Transport ation Apparel and Services Home Utilities, Fuel Housing, Furn, Maint. Food, Diet. Alcohol CO2 (MT)
Anna Nicholson Allen May 07, 2007 2.83
54
Expenditures by Category Annual ($) Annual (%) Food, Diet and Alcoholic Beverages 4,512 $ 6.0% Housing, Including Maintenance and Furnishings 7,043 $ 9.4% Utilities and Fuel Consumed at Home 2,372 $ 3.2% Apparel and Services 2,530 $ 3.4% Transportation 5,194 $ 6.9% Services/Personal 5,580 $ 7.4% Insurance and Investment 43,272 $ 57.7% Taxes/Government Services 4,510 $ 6.0% Totals 75,013 $ 100.0%
55
Odyssey Minivan, 21 mpg
for Energy, GWP, CO2, & Toxics
Total Total Energy by by
50,000 100,000 150,000 200,000 250,000 300,000
Taxes/Government Services Apparel and Services Services/Personal Housing Food Utilities Insurance and Investment Transportation
( M J ) ( M J )
0% 10% 20% 30% 40% 50% 60% 70% 80% 90% 100%
Total Energy = 518.5 GJ (242.4 is for transportation)
56
car (55 mpg)
for half of season’s games = 70% reduction in energy attributed to transportation
Total Total Energy by by
20,000 40,000 60,000 80,000 100,000 120,000
Taxes/Government Services Apparel and Services Services/Personal Housing Food Utilities Transportation Insurance and Investment
( M J ) ( M J )
0% 10% 20% 30% 40% 50% 60% 70% 80% 90% 100%
57
FOOD 5.2 MOBILITY 6.2 SHELTER 6.4 GOODS/SERVICES 11.4 TOTAL FOOTPRINT: 29
58
Baseline SM 30% SM 50% SM Food $7.70/day; mostly meats, grains, snacks & desserts; eats out infrequently ($30/month) $7.20/day; more money spent
plant-based proteins; meats, grains and snacks reduced but still a part of lifestyle; still eats out $5.90/day; vegan diet; snacks & desserts, eating
Utilities $ 300/year electricity; $600/year natural gas; $150/year water Electricity, na tural gas and water usage reduced by 25% Electricity and gas reduced by 50%; Water reduced by 33% Apparel $2530/year; mostly cut-and-sew No change No new clothing (children wear hand -me-downs) Transportation $600/year air transportation; drives 26 ,000 miles/year at 21 mpg $600/year air transportation; drives 25,000 miles/year at 45 mpg No air travel; drives 8 ,000 miles/year at 45 mpg Services Various services, including personal care, medical, recreation, electronic entertainment No change No services ex cept for medical Insurance and Investment No stock purchases $2,400 environmentally - friendly stock purchased annually $13,500 environmentally - friendly stock purchased annually
59
Baseline SM [GJ/year] 30% reduction [GJ/year] 50% reduction [GJ/year] Food 34.0 31.2 25.5 Housing 38.3 38.3 37.9 Utilities 45.6 34.1 24.5 Apparel 21.9 21.9 Transportation 242.4 130.7 52.5 Services/Personal 25.0 25.0 1.6 Taxes/Government Services 11.8 11.8 11.8 Total 419.0 293.2 208.8
Note: this calculation does not include insurance and investments
60
61
62
63
64
65
66