Lessons from San Francisco Lessons from San Francisco Mike - - PowerPoint PPT Presentation
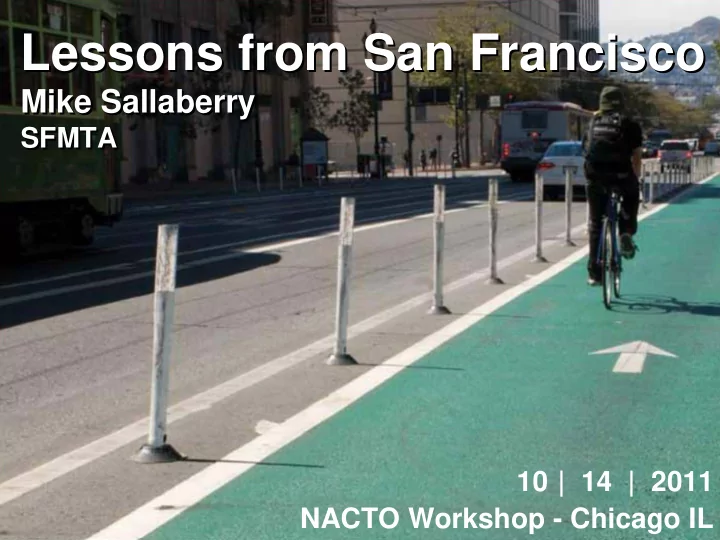
Lessons from San Francisco Lessons from San Francisco Mike Sallaberry Mike Sallaberry SFMTA SFMTA 10 | 14 | 2011 NACTO Workshop - Chicago IL Background 2 nd Highest Density in the U.S. 47 square miles Mild Climate
Background
- 2nd Highest Density in the
U.S.
- 47 square miles
- Mild Climate
- Population ~810,000
- Hilly (steepest hill 31.5%)
Space is a Limited Resource
Bicycle Traffic Signal at Fell/Masonic
SF State of Cycling Report identified top 3 barriers to more cycling
- Need for more
bike lanes
- Fear of cars
- Fear of crossing
major streets
How important a role do you think separated bikeways have or could have in making cycling more mainstream and popular?
Survey of ITE and APBP Members
50 100 150 200 250
Critical Important Neutral Not Important Detrimental
24% 50% 19% 4% 3%
Critical Important Neutral Not Important Detrimental
Cycle Track Advantages
- Cyclists physically separated from moving vehicles
- Buffer between bikeway and parking reduces risk of “dooring”
- Vehicles do not have to cross bikeway to park
- Reduced motorists blocking of bike space
San Francisco, CA
Traditional bikeways susceptible to being blocked by motor vehicles Cycletrack free of
- bstructions
Roadway Obstructions of Traditional Bike Lanes in Urban Areas
Cyclist Comfort on Busy Roadways
From London Cycling Design Standards
Separated Bikeways/Cycletracks in SF
Laguna Honda Boulevard Division Street Alemany Boulevard
Market Street
Separated bikeway, diversion of traffic, color
JFK Drive
(draft proposals)
Masonic Avenue
Complete Street and Raised Cycletracks proposed
Key Challenge: Cost
$20 Million to Construct
- Higher Visibility
- Marketing/Branding
- However, cost is 5x to 10x cost of
regular bike lane/marking
Colored Bicycle Facilities
14
vehicles per hour
Level of Service “F”
Peak Period
Unused Capacity Unused Capacity
# of vehicles per hour
Designing for Peak Motor Vehicle Flow
Extra Roadway Capacity is Common
Pavement to Parks - “Parklets”
A result of improved inter-agency coordination
Car parking spaces converted to ped/bike uses
16
On-Street Bike Parking/Corrals
1 car space = 10 to 12 bike spaces
Bicycle Boulevards/ Neighborhood Greenways
- Combination of Traffic
Calming Elements
- For Shared Bicycle
Routes and Neighborhood Greenways
- Slower Traffic = More
Comfort/Safety for Cycling and Walking
- Signals timing set to 13 mph progression at
11 intersections
- One of SF’s highest-use bicycle corridors (700
cyclists during 1.5 hour count – up from 220)
- Parallel corridors ideal for transit (Mission)
and automobile traffic (Guerrero)
- SF’s complex grid and topography limit where
green waves can be implemented
Valencia Green Wave
Automated Bike Counters
Mode Split in SF
Source: US Census American Community Survey
Means of Travel to Work % Drove Alone 36.0% Carpooled 7.9% Public Transit 34.1% Walk 9.4% Bicycle 3.5% Other* 2.4% Worked at home 6.7%
* “Other” is taxi, motorcycle, misc
Changes in Mode Share in SF
Source: US Census American Community Survey
Key Goal
Positive Feedback Loop
MORE PEOPLE RIDING
More demand
(for bicycle accommodation)
More accommodation More awareness
- f cyclists