
https://github.ubc.ca/ubc-mds-2016/DSCI_532_viz-2_students
Lectures 1&2: Manipulate & Interact
Tamara Munzner Department of Computer Science University of British Columbia
DSCI 532: Data Visualization 1I Lectures 1&2: 20 & 22 March 2017
What’s when
- 8 lectures in 4 weeks
–Mon & Wed, 11am-12:20pm (80 min), Mar 20 - Apr 12, ORCH 3058
- 4 labs
–Mon, 2-4pm, Mar 20 - Apr 12, ESB 1042 –start work Mon 2pm, due next Mon 9am, 12.5% each
- 2 quizzes: Week 3 (Mon Apr 3) & week 5 (Thu Apr 20)
–2-2:30pm, 25% each
- my (optional) office hrs are in ICICS/CS X661
–Mondays 5:30-6:30pm, Mar 20 - Apr 10 –or by appointment
2
Reading
- same as before
- core foundational material covered in lectures
- textbook as backup to lectures
–Tamara Munzner. Visualization Analysis and Design. CRC Press, 2014.
- library has multiple ebook copies for free
- to buy yourself, see http://www.cs.ubc.ca/~tmm/vadbook/
3
Topics
- Lectures 1&2
– Manipulate View
- Change over Time, Select, Navigate
- Lectures 3&4
– Facet Into Multiple Views
- Juxtapose, Partition, Layer
- Lectures 5&6
– Reduce Items & Attributes
- Filter, Aggregate, Embed
- Lectures 7&8
– Usability/Validation & Case Studies
4
Labs
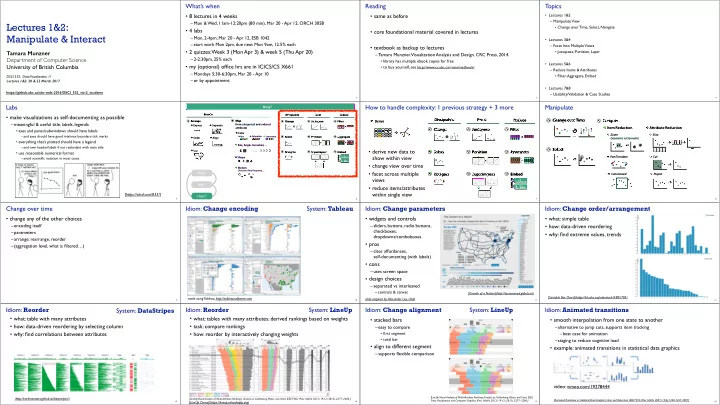
- make visualizations as self-documenting as possible
–meaningful & useful title, labels, legends
- axes and panes/subwindows should have labels
– and axes should have good mix/max boundary tick marks
- everything that’s plotted should have a legend
– and own header/labels if not redundant with main title
- use reasonable numerical format
– avoid scientific notation in most cases
5
[https://xkcd.com/833/]
6
Encode Arrange Express Separate Order Align Use Manipulate Facet Reduce Change Select Navigate Juxtapose Partition Superimpose Filter Aggregate Embed
How? Encode Manipulate Facet
Map Color Motion Size, Angle, Curvature, ...
Hue Saturation Luminance
Shape
Direction, Rate, Frequency, ...
from categorical and ordered attributes
How to handle complexity: 1 previous strategy + 3 more
7
Manipulate Facet Reduce Change Select Navigate Juxtapose Partition Superimpose Filter Aggregate Embed Derive
- derive new data to
show within view
- change view over time
- facet across multiple
views
- reduce items/attributes
within single view
8
Manipulate
Navigate Item Reduction
Zoom Pan/Translate Constrained Geometric or Semantic
Attribute Reduction
Slice Cut Project
Change over Time Select
Change over time
9
- change any of the other choices
–encoding itself –parameters –arrange: rearrange, reorder –(aggregation level, what is filtered…)
10
Idiom: Change encoding
made using Tableau, http://tableausoftware.com
System: Tableau Idiom: Change parameters
- widgets and controls
–sliders, buttons, radio buttons, checkboxes, dropdowns/comboboxes
- pros
–clear affordances, self-documenting (with labels)
- cons
–uses screen space
- design choices
–separated vs interleaved
- controls & canvas
11
[Growth of a Nation](http://laurenwood.github.io/) slide inspired by: Alexander Lex, Utah
Idiom: Change order/arrangement
12
- what: simple table
- how: data-driven reordering
- why: find extreme values, trends
[Sortable Bar Chart](https://bl.ocks.org/mbostock/3885705)
Idiom: Reorder
13
- what: table with many attributes
- how: data-driven reordering by selecting column
- why: find correlations between attributes
System: DataStripes
[http://carlmanaster.github.io/datastripes/]
Idiom: Reorder
14
- what: tables with many attributes; derived rankings based on weights
- task: compare rankings
- how: reorder by interactively changing weights
System: LineUp
[LineUp: Visual Analysis of Multi-Attribute Rankings. Gratzl, Lex, Gehlenborg, Pfister, and Streit. IEEE TVGC (Proc. InfoVis 2013) 19:12 (2013), 2277–2286.]
[LineUp Demo](https://lineup.caleydoapp.org)
Idiom: Change alignment
15
- stacked bars
–easy to compare
- first segment
- total bar
- align to different segment
–supports flexible comparison
System: LineUp
[LineUp: Visual Analysis of Multi-Attribute Rankings.Gratzl, Lex, Gehlenborg, Pfister, and Streit. IEEE Trans. Visualization and Computer Graphics (Proc. InfoVis 2013) 19:12 (2013), 2277–2286.]
Idiom: Animated transitions
- smooth interpolation from one state to another
–alternative to jump cuts, supports item tracking –best case for animation –staging to reduce cognitive load
- example: animated transitions in statistical data graphics
video: vimeo.com/19278444
16
[Animated Transitions in Statistical Data Graphics. Heer and Robertson. IEEE TVCG (Proc InfoVis 2007) 13(6):1240-1247, 2007]