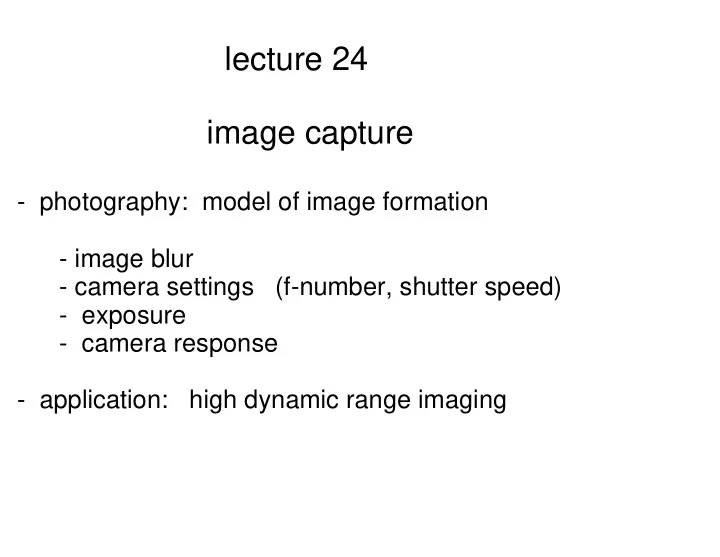
SLIDE 1 lecture 24 image capture
- photography: model of image formation
- image blur
- camera settings (f-number, shutter speed)
- exposure
- camera response
- application: high dynamic range imaging
SLIDE 2 Why learn about photography in this course?
- Many computer graphics methods use existing
photographs e.g. texture & environment mapping, image matting. Understanding them can only help us to better use them.
- Many computer graphics methods attempt to mimic real
images and their properties. See next slide
- Digital photographs can be manipulated to achieve new
types of images e.g. HDR as we'll see later
SLIDE 3
Geri's Game: Note the background is blurred.
https://www.youtube.com/watch?v=9IYRC7g2ICg
SLIDE 4
As we have seen, in computer graphics, the projection surface is in front of the viewer. We were thinking of the viewer as looking through a window.
SLIDE 5
In real cameras and eyes, images are formed behind the center of projection.
SLIDE 6 Aperture
Real cameras (and eyes) have a finite aperture, not a pinhole. The diameter A of the aperture can be varied to allow more
- r less light to reach the image plane.
SLIDE 7
Cameras (and eyes) also have a lens that focusses the light. Typically the aperture is in front of the lens, but for simplicity I have just drawn it as below.
Lens
SLIDE 8
For any point (x0, y0, z0), there is a corresponding point (x1, y1, z1), called the conjugate point. All the rays that leave (x0, y0, z0) and pass through the lens will converge on (x1, y1, z1).
SLIDE 9
For a fixed distance between the lens and sensor plane, some scene points will be in focus and some will be blurred. (I will spare you the mathematical formulas.) blurred blurred in focus (sharp) too close too far perfect
SLIDE 10
Depth of Field
"Depth of field" is the range of depths that are ~ in focus. [Definition: the blur width is less than the distance between pixels.]
SLIDE 11 How to render image blur ? (sketch only)
http://http.developer.nvidia.com/GPUGems/gpugems_ch23.html
Method 1: Ray tracing (Cook et al. 1984) For each point on the image plane, trace a set of rays back through the lens into the scene (using formulas I omitted). Compute the average of RGB values of this set of rays.
SLIDE 12
Method 2: "Accumulation buffer"
(Haeberli and Akeley 1990)
Render the scene in the standard OpenGL way from each camera position within the aperture (one image shown below). Each of these images needs to be scaled and translated on the image plane. (Again, I will spare you the math.) Then, sum up all the images.
SLIDE 13 lecture 24 image capture
- basics of photography
- image blur
- camera settings (f-number, shutter speed)
- exposure
- camera response
- application: high dynamic range imaging
SLIDE 14
Camera Settings
SLIDE 15
The total light reaching each point on the image plane depends on the intensity of the incoming light, and on the angle of the cone of rays which depends on the aperture. There is also a proportionality factor -- not shown.
* angleOfConeOfRays(x)
SLIDE 16
"Solid Angle" is a 2D angle. It is defined to be the area of a unit hemisphere (radius 1) covered by the angle. Angle has units radians (or degrees). Solid angle has units "steradians". e.g. You can talk about the solid angle of the sun or moon.
SLIDE 17
The solid angleOfConeOfRays is proportional to: (This is a familiar effect: the area of a 2D shape grows like the square of the diameter.) Angular width of the lens as seen from the sensor is The units are radians.
SLIDE 18
The total light reaching each point on the image plane (per unit time) is thus as follows, where L( l ) is the intensity of the light in direction l. Here we ignore color spectrum but in fact E( ) also depends on wavelength of light (see color lecture).
SLIDE 19
F-number (definition) = f / A
Since f / A (or its inverse) is fundamental to determining how much light reaches the image plane, this quantity is given a name. On typical cameras, the user can vary f-number: The mechanism for doing this is usually to vary the aperture.
SLIDE 20
It is also possible to fix the aperture and vary the focal length. wide angle narrow angle ("telephoto") fixed sensor area fixed sensor area
SLIDE 21
What happens when we vary the focal length as on the previous slide ? small f (wide angle) large f (telephoto) The image is darker for the larger focal length f. Why? Because the angle of the lens is smaller when viewed from a point on the sensor.
SLIDE 22
Shutter speed 1/t (t = time of exposure)
Image intensity also depends on t.
SLIDE 23
Application: Motion Blur (Cook 1984)
Exercise: very subtle rendering effect here. Can you see it?
SLIDE 24 lecture 24 image capture
- basics of photography
- image blur
- camera settings (f-number, shutter speed)
- exposure
- camera response
- application: high dynamic range imaging
SLIDE 25
Exposure
SLIDE 26
Camera Response
exposure, E * t
SLIDE 27
How does this relate to last lecture ?
The model for image RGB from last lecture was: In fact, a typical camera response mapping is
SLIDE 28
As we will see a few slides from now, it is useful to re-draw camera response curve as a function of log exposure. log exposure = log E + log t
SLIDE 29
In few slides, I will say how to compute this curve.
image capture
SLIDE 30 lecture 24 image capture
- basics of photograph
- image blur
- camera settings (aperture, f-number, shutter speed)
- exposure
- camera response
- application: high dynamic range imaging
SLIDE 31
Dynamic range
min max 'Dynamic range' of a signal is the ratio of the maximum value to the minimum value. If we look at log(signal), then dynamic range is a difference, max - min. Note that the dynamic range of an exposure image, E(x,y) * t, doesn't depend on the exposure time t.
SLIDE 32
A typical scene has a dynamic range of luminances that is much greater than the dynamic range of exposures you can capture with a single image in your camera. camera DR scene DR
log exposure = log E + log t
SLIDE 33
Example (scene dynamic range over 4000)
SLIDE 34
log exposure = log E + log t
camera's DR scene DR
SLIDE 35 How to compute camera response curve T( ) ? (Sketch only [Debevec and Malik 1997])
- Take multiple exposures by varying shutter speed
(as we did two slides back)
- Perform a "least squares" fit to a model of T( ).
(This requires making a few reasonable assumptions about the model e.g. monotonically increasing, smooth, goes from 0 to 255. Details omitted.)
- Option: compute separate models for RGB
SLIDE 36 Computing a high dynamic range (HDR) image
Given T( ) for a camera, and given a set of new images It(x,y)
- btained for several shutter speeds, 1/t,
- 1
Et(x,y) = T ( It(x,y) ) / t
Use the estimate Et(x,y) for which 0 << It(x,y) << 255 where the T ( ) curve is most reliable.
SLIDE 37
How to view a HDR image on a low dynamic range (LDR) display ?
This is the problem of "tone mapping". The simplest method is to compute log E(x,y) and scale values to [0, 255]. For example,
SLIDE 38
Tone mapping is a classical problem in painting/drawing. How to depict a HDR scene on a LDR display/canvas/print ? Typical dynamic range of paint/print is only about 30:1.
SLIDE 39
HDR has always been an issue in classical photography e.g. Ansel Adams, techniques for "burning and dodging" prints.
SLIDE 40
HDR images can now be made with consumer level software.
SLIDE 41 BTW, another image capture problem: Panoramas / image stitching
- available in consumer level cameras
- based on homographies (2D -> 2D maps)
- traditionally part of computer vision curriculum, but many
- f the key contributions are by graphics people and are
used in graphics
SLIDE 42 Announcement
- A4 posted (worth 6%), due in two weeks