
SLIDE 1
CO- EFFICIENCY Kharel 1 "Evaluation of Eco-efficiency of Iron and Steel Industries in Nepal" KHAREL, Abstract No. 114 (August 27-29, 2007)
Govinda Prasad Kharel From the Least Developed Country (LDC) Nepal Life Cycle Management (LCM) Industrial Ecology and Environment
LCM 2007 Presentation
Evaluation of Eco-efficiency of Iron and Steel Industries in Nepal
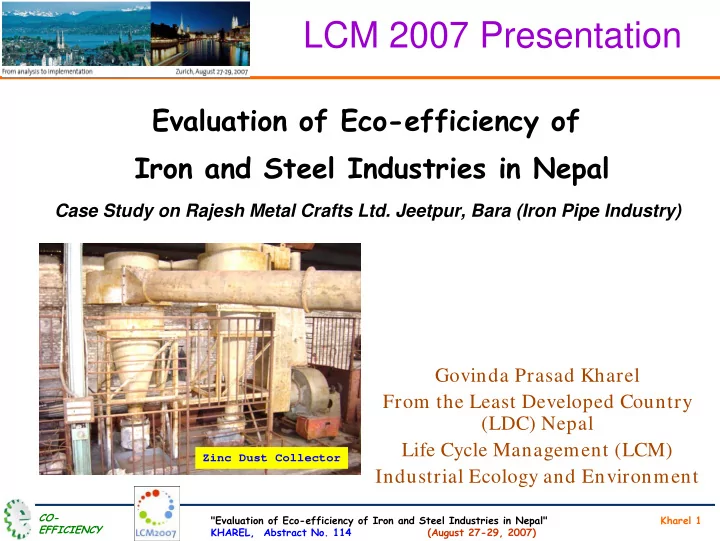
Case Study on Rajesh Metal Crafts Ltd. Jeetpur, Bara (Iron Pipe Industry)
Zinc Dust Collector