
SLIDE 1
18TH INTERNATIONAL CONFERENCE ON COMPOSITE MATERIALS
1
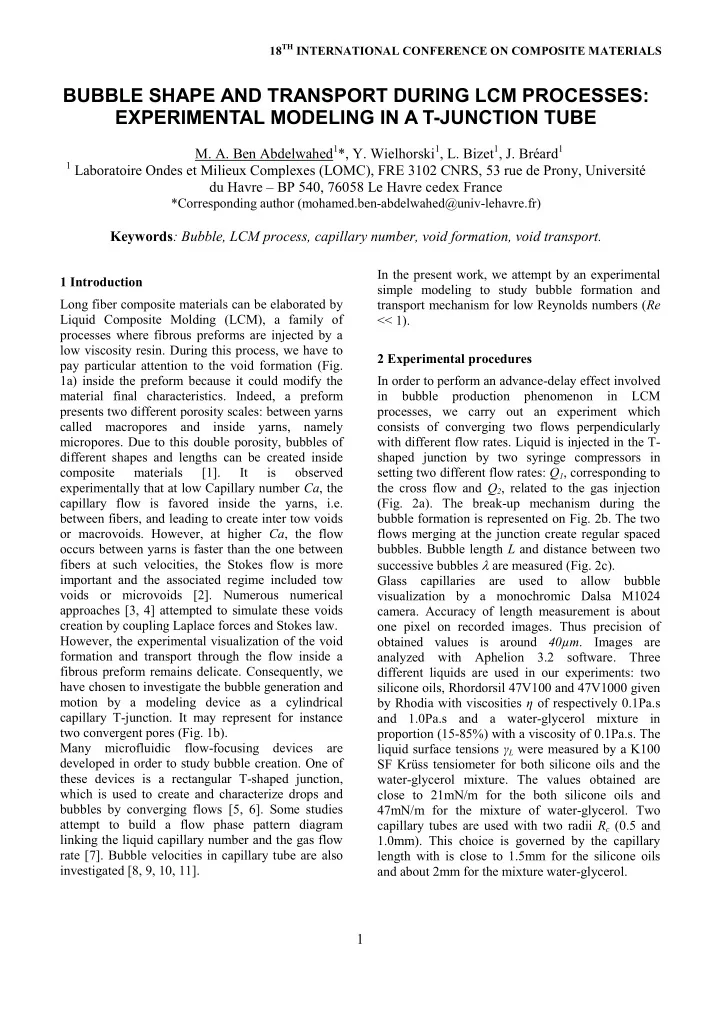
1 Introduction Long fiber composite materials can be elaborated by Liquid Composite Molding (LCM), a family of processes where fibrous preforms are injected by a low viscosity resin. During this process, we have to pay particular attention to the void formation (Fig. 1a) inside the preform because it could modify the material final characteristics. Indeed, a preform presents two different porosity scales: between yarns called macropores and inside yarns, namely
- micropores. Due to this double porosity, bubbles of
different shapes and lengths can be created inside composite materials [1]. It is
- bserved
experimentally that at low Capillary number Ca, the capillary flow is favored inside the yarns, i.e. between fibers, and leading to create inter tow voids
- r macrovoids. However, at higher Ca, the flow
- ccurs between yarns is faster than the one between
fibers at such velocities, the Stokes flow is more important and the associated regime included tow voids or microvoids [2]. Numerous numerical approaches [3, 4] attempted to simulate these voids creation by coupling Laplace forces and Stokes law. However, the experimental visualization of the void formation and transport through the flow inside a fibrous preform remains delicate. Consequently, we have chosen to investigate the bubble generation and motion by a modeling device as a cylindrical capillary T-junction. It may represent for instance two convergent pores (Fig. 1b). Many microfluidic flow-focusing devices are developed in order to study bubble creation. One of these devices is a rectangular T-shaped junction, which is used to create and characterize drops and bubbles by converging flows [5, 6]. Some studies attempt to build a flow phase pattern diagram linking the liquid capillary number and the gas flow rate [7]. Bubble velocities in capillary tube are also investigated [8, 9, 10, 11]. In the present work, we attempt by an experimental simple modeling to study bubble formation and transport mechanism for low Reynolds numbers (Re << 1). 2 Experimental procedures In order to perform an advance-delay effect involved in bubble production phenomenon in LCM processes, we carry out an experiment which consists of converging two flows perpendicularly with different flow rates. Liquid is injected in the T- shaped junction by two syringe compressors in setting two different flow rates: Q1, corresponding to the cross flow and Q2, related to the gas injection (Fig. 2a). The break-up mechanism during the bubble formation is represented on Fig. 2b. The two flows merging at the junction create regular spaced
- bubbles. Bubble length L and distance between two
successive bubbles are measured (Fig. 2c). Glass capillaries are used to allow bubble visualization by a monochromic Dalsa M1024
- camera. Accuracy of length measurement is about
- ne pixel on recorded images. Thus precision of
- btained values is around 40µm. Images are
analyzed with Aphelion 3.2 software. Three different liquids are used in our experiments: two silicone oils, Rhordorsil 47V100 and 47V1000 given by Rhodia with viscosities η of respectively 0.1Pa.s and 1.0Pa.s and a water-glycerol mixture in proportion (15-85%) with a viscosity of 0.1Pa.s. The liquid surface tensions γL were measured by a K100 SF Krüss tensiometer for both silicone oils and the water-glycerol mixture. The values obtained are close to 21mN/m for the both silicone oils and 47mN/m for the mixture of water-glycerol. Two capillary tubes are used with two radii Rc (0.5 and 1.0mm). This choice is governed by the capillary length with is close to 1.5mm for the silicone oils and about 2mm for the mixture water-glycerol.
BUBBLE SHAPE AND TRANSPORT DURING LCM PROCESSES: EXPERIMENTAL MODELING IN A T-JUNCTION TUBE
- M. A. Ben Abdelwahed1*, Y. Wielhorski1, L. Bizet1, J. Bréard1