
25/10/13 ¡ 1 ¡
EXAMINING DAILY COMMUTING PATTERNS USING GIS
Bart Dewulf
25/10/’13
Dewulf Bart1,2,3, Tijs Neutens1,2, Mario Vanlommel1,4, Steven Logghe4, Philippe De Maeyer1, Yves De Weerdt3, Nico Van de Weghe1
1Department of Geography, Ghent University, Krijgslaan 281, S8, B-9000, Ghent, Belgium 2Research Foundation Flanders, Egmontstraat 5, B-1000, Brussels, Belgium 3VITO, Boeretang 200, B-2400, Mol, Belgium 4BeMobile, Technologiepark 12b, B-9052, Ghent, Belgium
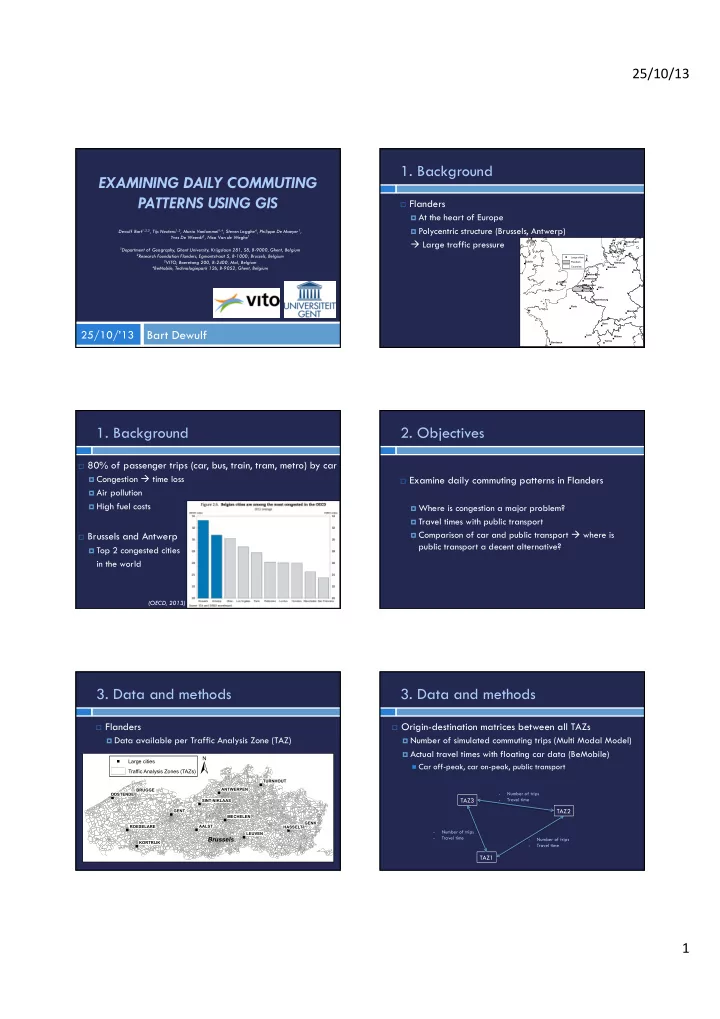
- 1. Background
¨ Flanders ¤ At the heart of Europe ¤ Polycentric structure (Brussels, Antwerp)
à Large traffic pressure
" " " " " " " " " " " " " " " " " " " Köln Bern Lyon Paris Berlin Bremen London Dublin Torino Milano Hamburg München Bordeaux København Antwerpen Bruxelles Amsterdam Rotterdam Luxembourg
±
" Large cities Flanders Countries
- 1. Background
¨ 80% of passenger trips (car, bus, train, tram, metro) by car ¤ Congestion à time loss ¤ Air pollution ¤ High fuel costs ¨ Brussels and Antwerp ¤ Top 2 congested cities
in the world
(OECD, 2013)
- 2. Objectives
¨ Examine daily commuting patterns in Flanders ¤ Where is congestion a major problem? ¤ Travel times with public transport ¤ Comparison of car and public transport à where is
public transport a decent alternative?
- 3. Data and methods
¨ Flanders ¤ Data available per Traffic Analysis Zone (TAZ)
" " " " " " " " " " " " " GENK GENT AALST BRUGGE LEUVEN HASSELT OOSTENDE KORTRIJK TURNHOUT MECHELEN ROESELARE ANTWERPEN SINT-NIKLAAS
±
"
Large cities Traffic Analysis Zones (TAZs)
Brussels
- 3. Data and methods
¨ Origin-destination matrices between all TAZs ¤ Number of simulated commuting trips (Multi Modal Model) ¤ Actual travel times with floating car data (BeMobile) n Car off-peak, car on-peak, public transport TAZ1 TAZ2
- Number of trips
- Travel time
TAZ3
- Number of trips
- Travel time
- Number of trips
- Travel time