SLIDE 1
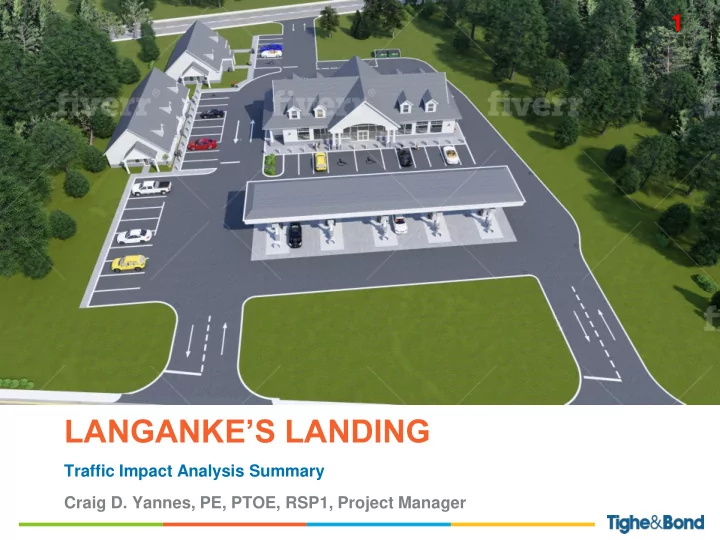
LANGANKE’S LANDING
Traffic Impact Analysis Summary Craig D. Yannes, PE, PTOE, RSP1, Project Manager
1
SLIDE 2 STUDY AREA - EXISTING CONDITIONS
N
APRIL 2016 MAY 2019
2
SLIDE 3
- Observations during peak periods – T&B Office located at
1000 Bridgeport Avenue – Study Area on Employees Commutes
- Turning Movement Counts (7:00-9:00 AM & 4:00-6:00 PM)
AM Peak Hour: 7:30 AM to 8:30 AM or 7:45 to 8:45 AM PM Peak Hour: 4:30 AM to 5:30 PM or 4:45 to 5:45 PM
- Hourly Traffic Volumes Bridgeport Ave & Huntington Street
(72 Hours)
Moderate Delays & Queues at the following: Huntington Rd. NB in AM – Traffic from Rt. 8 Huntington St. SB in AM – Traffic to Rt. 8 Bridgeport Avenue for WB Left Turns in PM – Traffic to Rt. 8 No Significant Delays & Queues at Stop Controlled Intersections
EXISTING OPERATIONS & OBSERVATIONS
Location Average Daily Traffic Travel Speed (MPH) Bridgeport Avenue 13,620 vehicles 43 EB; 41 WB Huntington Street 10,605 vehicles 42 NB; 44 SB
3
SLIDE 4 PROPOSED CONDITIONS
Market
Station
- 4,200 SF Retail
- 2,000 SF Office
- 3 Full Access Driveways
– Stop Controlled on Driveway Approach 4
SLIDE 5
Station
Counts at Cumberland Farms on Route 25 in Monroe 50% pass-by trips – account for visits to the site from existing traffic stream – not new trips to the study area
ITE Trip Generation Manual 10th Edition Online Database that Compiles Traffic Count Data from Similar Uses
TRIP GENERATION METHODOLOGY
5
SLIDE 6
TRIP GENERATION
6
SLIDE 7
CAPACITY ANALYSIS RESULTS - LOS
7
SLIDE 8
CAPACITY ANALYSIS RESULTS - QUEUE
8
SLIDE 9
- 4,400 SF Convenience Market; 10 Fueling Position Station;
2,100 SF Retail; 1,000 SF Office
- 3 Full Access Driveways: 2 on Bridgeport Avenue, 1 on
Huntington Street – Stop Control on Driveways
- New Site Generated Traffic based upon Counts & ITE Data
AM Peak: 130 new trips PM Peak: 138 new trips
- Pass-By Traffic Analyzed at 50% Accounting for Site Trips
from Existing Traffic Volume
- Minimal Operational Impact of Additional Traffic – All
approaches operate at LOS D or better except driveways which have space to store accommodate the expected vehicle queues
- Recommend signal timing optimization in AM to improve
- perations to existing conditions
CONCLUSIONS
9
SLIDE 10
ADDITIONAL SLIDES
10
SLIDE 11 STUDY AREA - EXISTING CONDITIONS
N
APRIL 2016 MAY 2019
11
SLIDE 12 STUDY AREA - EXISTING CONDITIONS
BRIDGEPORT AVE.
N
12
SLIDE 13
BRIDGEPORT AVENUE LOOKING NORTHWEST
13
SLIDE 14
BRIDGEPORT AVENUE LOOKING SOUTHEAST
14
SLIDE 15
HUNTINGTON STREET LOOKING NORTHWEST
15
SLIDE 16
HUNTINGTON STREET LOOKING SOUTHEAST
16
SLIDE 17
SITE PLAN
17
SLIDE 18 SIGNAL RETIMING
Phase 1 Bridgeport Avenue WB Phase 2 Shelton Road EB Phase 4 Huntington Road/Street NB & SB Existing AM & PM 20 seconds 25 seconds 30 seconds Background AM & PM
(Proposed Changes from Fountain Square Project)
25 seconds (+5 seconds) 21 seconds (-4 seconds) 29 seconds (-1 second) Proposed AM Only
(PM to remain at Background Timing)
20 seconds (No Change) 21 seconds (-4 seconds) 34 seconds (+4 seconds)
Bridgeport Avenue at Huntington Road/Street & Shelton Road
Phase 1 Phase 2 Phase 4
18
SLIDE 19
CAPACITY ANALYSES
Level of Service Signalized Intersection (Average Delay in seconds per Vehicle) Unsignalized Intersection (Average Delay in seconds per Vehicle) A 10 10 B >10 and 20 >10 and 15 C >20 and 35 >15 and 25 D >35 and 55 >25 and 35 E >55 and 80 >35 and 50 F >80 >50
Source: Highway Capacity Manual, 6th Edition
19
SLIDE 20
SIGNAL PLAN
20
SLIDE 21 2020 EXISTING TRAFFIC VOLUMES
SOURCE: TURNING MOVEMENT COUNTS – JANUARY 15, 2020
21
SLIDE 22 2021 BACKGROUND TRAFFIC VOLUMES
SOURCE: 2020 EXISTING + 1.2% ANNUAL GROWTH + SITE TRAFFIC VOLUMES FROM FOUNDTAIN SQUARE, 899 BRIDGEPORT AVE, & SHELTER RIDGE PROJECTS
22
SLIDE 23 TRAFFIC DISTRIBUTION
SOURCE: EXISTING TRAVEL PATTERNS AND ROADWAY LAYOUT
23
SLIDE 24 SITE GENERATED TRAFFIC
SOURCE: TRIP GENERATION x TRAFFIC DISTRIBUTION
24
SLIDE 25
PASS-BY TRAFFIC
25
SLIDE 26 2021 COMBINED TRAFFIC VOLUMES
SOURCE: 2021 BACKGROUND + SITE TRAFFIC + PASS-BY TRAFFIC
26
SLIDE 27
COLLISION HISTORY
27
SLIDE 28
COLLISION HISTORY – BRIDGEPORT AVENUE AT HUNTINGTON STREET
28
SLIDE 29
COLLISION HISTORY – BRIDGEPORT AVENUE AT SOUTH SITE DRIVEWAY
29
SLIDE 30
COLLISION HISTORY – HUNTINGTON STREET AT ISINGLASS ROAD AND NORTH SITE DRIVEWAY
30
SLIDE 31
- Sight Distances from Bridgeport Avenue
Driveways over 500’ in each direction
- Sight Distances from Huntington Street Driveway:
Over 500’ looking right 350’ looking left limited by mature maple trees
- Vegetation along site frontage should be regularly
maintained to maximize sight distances
- Existing conditions in operation for many years
and collision data review shows no significant crash patterns
INTERSECTION SIGHT DISTANCE
31