
SLIDE 1
Laboratory Grease Analysis with Grease Thief Sampling & Analysis System
- Grease Thief Die Extrusion
- Analex fdM+
- Metal Spectroscopy
- RULER
- FT‐IR
- Analytical Ferrography
- Rheology
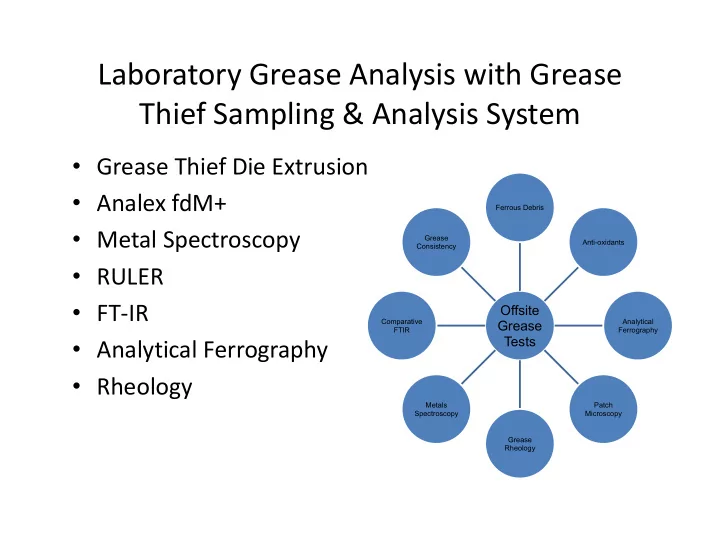
Offsite Grease Tests
Ferrous Debris Anti-oxidants Analytical Ferrography Patch Microscopy Grease Rheology Metals Spectroscopy Comparative FTIR Grease Consistency