
SLIDE 1
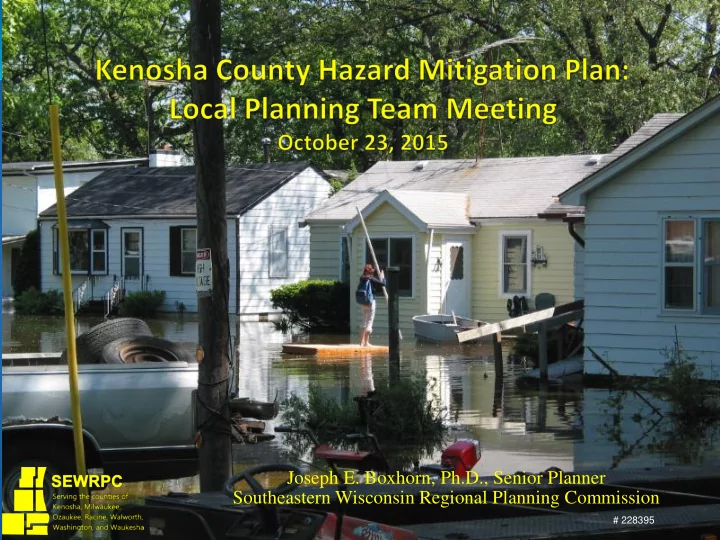
Joseph E. Boxhorn, Ph.D., Senior Planner Southeastern Wisconsin Regional Planning Commission
# 228395
Joseph E. Boxhorn, Ph.D., Senior Planner Southeastern Wisconsin - - PowerPoint PPT Presentation
Joseph E. Boxhorn, Ph.D., Senior Planner Southeastern Wisconsin Regional Planning Commission # 228395 Chapter I Introduction and Background Chapter II Basic Study Area Inventory and Analysis Hazard and Vulnerability Assessment Tool Hazard
# 228395
Risk = 100 x [(probability/3) x (Human impact + Property impact + Business impact + Preparedness)/(4 x3)]
Transportation-related
Hazard Material Incidents
Thunderstorm-related
Drought, Flooding, Thunderstorms, Tornadoes
Hazardous Material Incidents, Transportation Accidents
Hazard Years Incidents Property Damages Crop Damages Total Damages Automobile Accidents 15 53,241 910,728,500 910,728,500 Flood 52 50 30,777,884 31,634,644 62,412,528 Thunderstorms/Wind 51 185 27,534,248 5,021,965 32,556,213 Tornadoes 51 13 25,386,789 25,386,789 Lightning 51 16 18,201,588 18,201,588 Railway Accidents 40 212 4,780,633 4,780,633 Drought 25 17 3,757,011 3,757,011 Pipeline Hazmat 39 5 3,018,699 3,018,699 Hail 51 51 244,327 61,204 305,531 Temperature Extremes 21 51 16,163 81,526 97,526 Winter Storms 21 105 42,762 42,762
Note: All damages are in 2014 dollars
Hazard Years Incidents per Year Annual Property Damages Annual Crop Damages Total Annual Damages Automobile Accidents 15 3,549.14 60,715,233 60,715,233 Flood 52 0.96 591,882 608,359 1,200,241 Thunderstorms/Wind 51 3.63 539,887 98,470 638,357 Tornadoes 51 0.25 488,207 488,207 Lightning 51 0.31 356,894 356,894 Drought 25 0.68 150,280 150,280 Railway Accidents 40 5.30 119,516 119,516 Pipeline Hazmat 39 0.13 77,403 77,403 Hail 51 1.00 4,791 1,200 5,991 Temperature Extremes 21 2.43 770 3,874 4,644 Winter Storms 21 5.00 2,036 2,036
Hazard Years Incidents Fatalities Injuries Total Automobile Accidents 15 53,241 316 29,074 29,390 Sexually-Transmitted Diseases 9 7,686 7,686 7,686 Communicable Diseases 9 3,114 3,114 3,114 Railway Accidents 40 212 15 49 64 Thunderstorms/Wind 51 185 6 60 36 Aviation Accidents 51 144 11 11 22 Temperature Extremes 21 51 4 11 15 Tornadoes 52 13 15 15 Pipeline Hazmat Accidents 39 5 3 4 7 Lightning 51 16 1 5 6 Winter Storms 21 105 1 1 Land Subsidence 15 1 1 1 Dam Failure 1 1 1 1
Hazard Years Incidents per Year Fatalities per Year Injuries per year Annual Total Automobile Accidents 15 3,549.40 21.07 1,938.27 1,959.34 Sexually-Transmitted Diseases 9 854.00 0.00 854.00 854.00 Communicable Diseases 9 346.00 0.00 346.00 346.00 Railway Accidents 40 5.30 0.38 1.23 1.61 Dam Failure 1 1.00 0.00 1.00 1.00 Temperature Extremes 21 2.43 0.19 0.52 0.71 Thunderstorm/Wind 51 3.63 0.12 0.59 0.71 Tornadoes 52 0.25 0.00 0.29 0.29 Aviation Accidents 51 2.88 0.22 0.22 0.44 Pipeline Hazmat 39 0.13 0.08 0.10 0.18 Lightning 51 0.31 0.02 0.10 0.12 Land Subsidence 15 0.06 0.00 0.06 0.06 Winter Storms 21 5.00 0.00 0.05 0.05