
SLIDE 1
Joint Cotntnittee on Appropriations Fiscal Year 2013 South Dakota - - PDF document
Joint Cotntnittee on Appropriations Fiscal Year 2013 South Dakota Investment Council February 8, 2012 u> .C CURR.E,'\"T COUNCIL \:!EMBERS: ~~,ith:\? Board J c,seph A. Anglir~ S pea..JJ sh ( Chm ) W es ley G. T h ette,, Br ooking~ (Vice
CURR.E,'\"T COUNCIL \:!EMBERS:
Jc,seph A. Anglir~ Spea..JJsh (Chm) Wesley G. T«hette,, Brooking~ (Vice Chair) Hugh !vl Barte!s, Watertown fon Hw1oter: ~fadiron
Jim Moaru. Y .nh. i on
Jarrod JobJ~on~ S&PL Com:iillssioner Richard S;:.ttg~~
S'bte Tr2'.aSllll'o:r Rob Wylie, SDRS Admioistrator
.:\s:t hl.;."ESt Officer 0 lobal! Eq I • .;xb:tt.ag:
Global Equjty
s:,.·, S,lwft.
Global Equjty
Jal'l2t6d
~rn"o!!io:!\wi..;:!S!;er Global Eqtriry
Dc:r
c.i Hmi.g A!:· !"oc Ponfolfo Mgr
Global Eqiljrf J,ff'El/ef.0n k!"oc Portfolio ;,._ ~ Global Equjty P.er.ceP..ar.daJ
Br-
t'IL'I Fiigg~
Portful:io ).~a:;icr Globo.!Eq,
.. 'ty Me-1"i.ssa H. Woi'{l!la
PortfoUo ).larJa:;er Glolr- dEq,.c'ty CaiuiiCrurfsr
A.:::Eoc Portfolio • -
m
Glolr- d F.q,L'ty -
Ar',11r.J'ofl Re>ifE,!d! A.::.:oc Portfolio M?I
Glolr- .! Eq,_.'ty - Rm$ 3pir.ar A!~ Portfolio l\.!a" Glolr- d Eq,.c'ty- lesJ1ieJJ-
.e
u>.C
~~,ith:\? Board
Souttl.D-dota Im.:-€- !tlfiln!C011lld.l Officer .
A.sn [oye:.1 O:ft1:er
Fix~ ilh:01.'1e'.Ji.lt llilv Chr' .:.Nf'k.on
Sr,rl.lid Cap Equir:,·
.Sc.orz He.s:; A.::.:oc Pmtfolio li.fu 5m&Iid Cap Equir, Jarrod Edsis n A.::.:oc Portfolio M?J
Sm1 1\lid Cap Eqwr: , futPrari'er .il:wc Portfolio • fu Sml!,lid Cap Equi,y
.A.::i:2m Schu.=.a?.> Bu.::lir.~:S
~.:ma.s:er
l.aDie.Rfss
Fix~
EntOU!.e.iHESP .Shs7* _
\~·t.son
Ccmv Arb)Hj:::h Yi-ei.d RtJz&D~!S ·"'" Portfolio Mer Ccmv ArlvHigh Yield
.Dani. el.!e ScY'..tr
..
fri!
Re:::ea.rcb_~,:t Ccmv .iub
.iJ-ligh Yield
(t:,;ie Dos. ~.f6r
Se:retar\O'
Re:~jcctin
..laANJ Cd~
aF .m~ A::::t Icr
i.'l:st Office
Fir....e.<tili.C-cm.i:,'0->"
... riv
Tam: my Orrrn Secior Inve.:'W!.e!I.:
.t.i..cCO" JD[at'.If:
Cinqt..' Plclrc7i"ng
[n\'-,!~1m:l!lt
.l1.rc()"IJD[ant
~JKangas
Im·
i!:.11:l:!:.l!it
}1.(CQrlJD[:mt
Peggy NaRssig
[O '\'i!;;ttl!:flt
.l1 .rcO"mrant ~V: .maJ Su.i'ey
July 2011
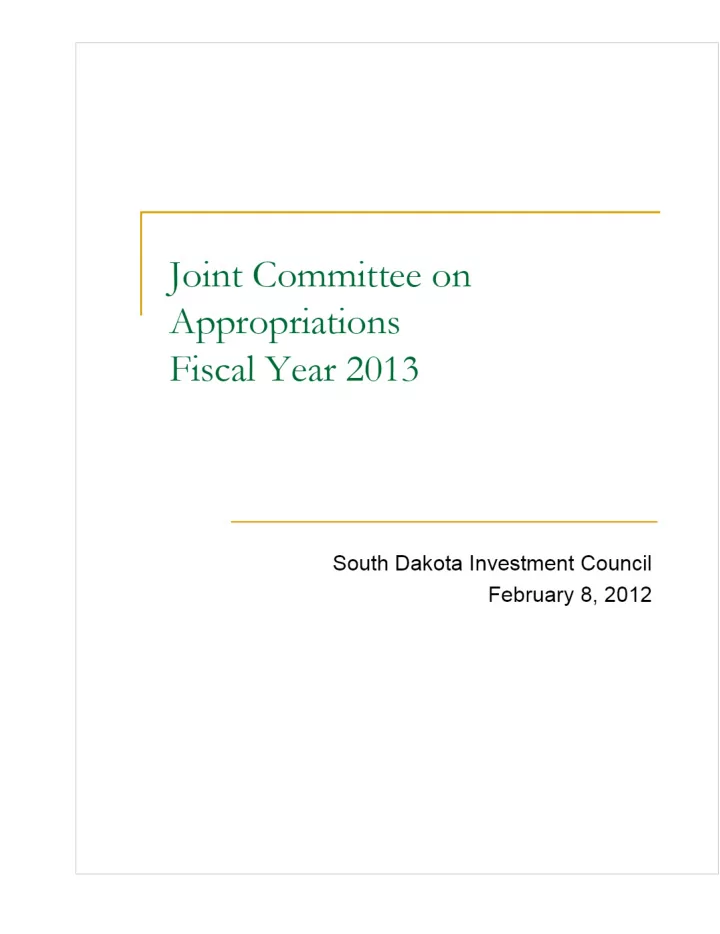
South Dakota Investment Council Assets Managed Fiscal Years 1973 to 2011 and Fiscal Year 2012 through 12/31/11
OI
X
..
0\
...
,;:;
... Ill
~
i
...
...
,;:;
...
..
"'
..
:1
~
..
...
:g ~ "
Assets as of December 31, 2011
...
...
...
...
D South Dakota Retirement System
$ 7,453.0
78.l')'
c,
:I
~ Healthcare Trust Fund
$ ...
...
101.l 1.0%
:::
,,; q ,,;
...
... "' ... "' D Educatioo Enhancement Trust Fund
367.8 3.9%
...
"l rll
"'
...
Cemen Plant Retirement Fund 45.5 0.5%
"'
i,t
..
a School & PUb!ic Lands Fund
182.0 1.9%
..
...
..
a Dakota Cemait Trust Fund
235.8
2.5~ '
c,
..
South Dakota Ca, sh Flow Fund
~
12 . .
1'%
"'
..
5 9,538,3 100.0%
... "!
... ... "'
~ ..
t
~ ~
~ ...
1:1
~ ~
...
~
::l,
...
~ ~
...
0 ~* N ..
..,
OI ..l ...
"' ~ .. I ~ ..
....
~
..; ...
0 ..
..l
...
...
l?l
.,,
M
.. "'
\0 " .. 0\ 0 ... ....
M .. "' ., ... .. OI
... N
C'l"I.. .. \0 ... .. 0\
0 ... N M .. VI \0 ... co 0\ 0 ::: ~
... ... ... ... ... ... ... .. .. .. .. co co .. .. .. .. 0\ OIOIOIOI ... ...
0\ ... "' 0 ... Fiscal Year
2
SOUTH DAKOTA INVESTMENT COUNCIL Budget Process & Long-Term Plan
I. Investment Council Budget Process A) Budget approved by LRC Executive Board before presenting to Bureau of Finance and Management and Appropriations Committee - SDCL 4-5-22 B) Budget deducted from assets under management - no general fund appropriation - SDCL 4-5-30 II. Developed Long-Term Plan - began in 1987 A) Recommended by Appropriations Committee to encourage internal management and recognize the potential need for outside management B) Supported by LRC Executive Board
3
SOUTH DAKOTA INVESTMENT COUNCIL Long-Term Plan Executive Summary INVESTMENT OFFICE BUDGET Personal Services Number of Employees Compensation w/0% Investment Performance Incentive Total Maximum Potential Investment Perf Incentive Compensation w/100% max potential Invest Pert lncenlive Intern Counc il Longevity Benefits Total Personal Services Operating Expenses Contractual - Investment Ser.rices Contractual - Administrative Services Travel Office Supplies & Postage Capital Assets Total Operating Expenses Total Investment Council Budget AS SET SUM MARY * Internal Assets External Assets Total Retirement System Assets Total Assets EXPENSE SUMMARY Internal Expenses External Manager Fees Total Expenses UNIT COST SUMMARY
1
nternal Expenses as % of Total Assets
1
nternal Exp as % of Total Assets (112 assumed incentives) Total Expenses as % of Total Assets
613011 1 asre1s. Updated each Jt.ne 30. [28) 3,949,267 3,280,528 7,229,795 20,481 7,875 7,508 1,187,208 8,452,866 956 ,400 514,897 73,000 12,733 28,242 1,585,272 10,038,138 8,270,546,085 2,756,848,695 8,997,377,074 11,027,394,781 10,038,138 30,325,336 40,363,474 0.091% 0.076% 0.366% [301 [30] 6,109,015 8,289,744 5,164,900 7,223,883 11,273,9· 1
s
15,513,627 23,743 27,524 7,875 7,875 12,091 19,473 1,849,300 2,543,893 13,166,923 18,112,391 1,253,019 1,568,182 623,795 757,534 97,457 123,202 17,246 21,803 41,240 50,018 2,032,757 2,520,738 15,199,681 20,633,129 10,767,420,148 14,125,727,313 3,589,140,049 4,708,575,771 12,165,670,834 16,455,797,703 14,356,560,197 18,834,303,084 15,199,681 20,633,129 39,480,541 51,794,333 54,680,221 72,427,463 Q _ 106% 0.110%
0.088% 0.090%
0.381% 0.385% 812011
4
$0.91 *
SDIO
Internal
Cost
(per $1,000) $3.66 *
5010
Internal&
Outside Managers $1 Billion
Median Pension Flmd
By Keeping Costs Low ...
$8.95
Bendimark (Similar Size and Asset Mix)
$11.90
Median Mutual Funds
$17.00
Median
Alternative
Asset
Managers
The cost difference between SO/O's $3. 66 and the Benchmark (similar size and asset mix) of $8.95 is approximately $52 million per
wealth grows an EXTRA $7 billion by keeping costs fowl
5
SOUTH DAKOTA INVESTMENT COUNCIL FISCAL YEAR 2011
Year End Budget Summary PERSONAL SERVICES Compensation with 0% Invest Performance Incentive Total Maximum Potential Incentive Compensation w/100% max potential Invest Perf lncent Intern Council Compensation Longevity Personal Benefits Total Personal Services OPERATING EXPENSES Contractual Services (see next page torline item details) Travel Office Supplies & Postage Capital Assets Total Operating Expenses TOTAL BUDGET
7,689_ 17 Allianz reimbtJSement & delayed promotion increases for iowstment ace ounta nts " .An additional S6,692.13 in Bloomberg fees were incm ed but waived due o securi ·es transactions executed llrnug !heir trading system. Received FY 201 1 3,314,44() 2,808,345 6,122,785 19,884 7,875 6,335 1.016 685 7,173,564 1,625,79() 73,000 14,148 31,380 1,744,318 8.917 882
FISCAL YEAR 2012 Budget Funding (SDCL 4-5-30)
FY 2012 AUTHORIZED BUDGET LESS FY 2011 CASH BALANCE REMAINING FY2012 BALANCE TO BE FU DED
Actual Exp FY 2011 3,253,787.54 1,575,352.85 4,829, 14().39 0.00 2,550.00 6,335.00 839,125.76 5,677,151.15 1,21 1,444.42 •• 46,276.65 10,925.63 22,727.87 1,291,374.57 6.968 525.72 8,699,288.0()
(1 ,949,356.28)
6 749 931.72 Unexpended 60,652.46 • 1,232,992.15 1,293,644.61 19,884.00 5,325_ 00 0.00 177 559.24 1,496,412.85 414,345.58 26,723-35 3,222-37 8,652-1 3 452,943.43 1.949 356.28
6
CONT RACTUAL SERV IC ES Inves tment Services C onsulting SeM ces Const.ffir,g!Comp .Analysis/Asset Aloe/etc . Conslltant-Steve 1yers (March, 2010 - Jur.e, 201 1) Subtotal lnvestn ent Acc ounting, Pe. rlormanoe, Benc hmarkin;i BNY/Me llon Pe/'iormance & Risk A nalysis S&P 12 S&P 1000 S&P 12 D - Add'I - Iran free Portia Subtotal
Investment Databases, Newsfeeds & Qoote Fees
Bloomberg Factset Reuters Fund ame nlal Index Quale Fees ~ncl. Bloomberg/Factse ) Dow Jones Ne1 Ns S ervice Subtotal
ln•;estment esearch Servic.as
KDP High Yield Stone "1cCar',hy Gimme C redit Fl Research Ci Ii group Yield Book / BB Index PCS-Wal Stre et Access & EL.ape an Research (cano• leli) PCS-. American ,1 erge rs (caacelled) PCS--Asia Pacific Mergers (cancelled) Credi! Sighls lndie Resea rch-Insider Score Gerson Lemman (cancelled) Morningstar Equily The Markets.com First Rain V alue Li lle Manage ment CV Flexibility- From Brokerag e to lndependenl Research Subtotal Total Investment Services Administrative Expenses Office Ren! Bond/liability Insurance Telepoone Office Eq uip RentaVMaintenance Bureau of lllfo & Telecommunications (BIT) State Ceri1ral Seroices Legislative Audit C ustodial Fees - Global Seminars/Educational Programs Business Public ati ans Total Administrative Expenses TOTAL C ONTRACTUAL SERVIC ES
" AA additional $6,692.13 in Blocrnberg fees were incurred but wai1'Ed
due to sec unties 1ransac tions executed through I heir tretding systtem. Received Actual Exp FY 20· 11 FY 2011 Unexpended 80,COO
a.co
80,000. 0
SO.COO
55,530.95 (5,530.95) 130.000 55530.95 74469.05 20,COO 20,000.m
12,COO 12,000.m
8,000.00 (8,000.m)
SO.COO
38 559.33 11 440.67 82.COO 78 559.33 3 440.67 146,475 115,:o1.21 31,273.79 160,315 164,$9.04 (4,354.04) 24,COO 25,188.m (1,188.00) 54,035 44,323.07 9,762.93 34,804 35,946.m (1,1 42.00) 419.680 385,327. 32 34,352.68 20,COO 15,800 00
4,40000
4,305 4,14000 165.00 25,COO 23,153.00 1,847.00 10,COO
28,350 12,000.m 16,35{).00 12,600
a.c
5,000.00 (5,000.00) 42,COO 45,000.00 (3,0C0.00) 14,COO 16,800.m (2,8{Xl.00) 40,COO
a.c
30,COO 46,375 m (16,375.C O) 13,261) 13,554 84 (294.84) 14,COO 000 14,000 0 6,10l'.l00 (6,10l'.l00) 15,000.0l'.l (15,000.0l'.l)
206 000 O .Ol'.l
2060:JO.Ol'.l 459 515 202722.84 2:6 792.16 1,091,195 722,140.44
369,054.56
101,542 101,541.84
7,0211 0.0l'.l 7,02000 10,COO 4,441.08 5,558.92 6,00J 4,721.91 1,278.09 37,448 42,946.41 (5,493.41) 9,00J 7,974.15 1,025.85 37,135 31 ,8D5.61} 5,529.40 288,750 275,499 92
13,250 06 33,500
16,919.!l<J
16,581 0
4.200 3,654.07 545.93 534595 489313.93
45,291 . 2
1;625 79D 1 211 444.42
414 345.58
7
SOUTH DAKOTA INVESlMENT COUNCIL BUDGET REQUEST SUMMARY Fiscal Year 2013
following exhibits. Version B is provided for informational purposes as the originally approved budget by the Investment Council in June 2011 and the LRC Executive Board in August 2011.
median industry cost of $4 93 per $1,000 of assets.
Total Personal Services increases 4.57% O Compensation Study: The Deloitte compensation study, updated in the spring of 2010, suggested compensation for investment positions had fallen to a 35% discount after cost-of-living adjustments. The Council's target in our long-term plan is a 30% discount in an attempt to balance the desire to get a good deal for South Dakota (quality results and low cost) with the risk of losing a good deal if we cannot keep our people. The reductions in investment position salaries in FY2012, together with expected moderate increases in industry pay for such positions, pushes the discount to more than 40%. The compensation study is expected to be updated again in the spring of 20 13. O Compensation: Total compensation for investment positions is expected to consist of tvm-thirds in the form of base compensation and one-thi1·d in return-linked incentive compensation (assuming a 50% average incentive over time). The total maximum incentive budget is funded at 85%. Base salaries include a 4.8% increase for the 22 investment positions according to the long-term plan, and a 3% increase for the accounting and administrative positions In addition: The newer and intermediate level team members increase an addit.ional 1% to 15.2% for promotion increases as they continue transitioning through the steep learning curve from entry level to senior investment team members. The investment accounting positions are increasing an additional 2% to 3% to more closely reflect industry compensation levels for accountants with CPA designations and their increased years of experience.
from 0% to a maximum of 100% of base salary. Incentives are paid only if earned by superior
across all positions in total has averaged 40% to 60% of the maximum. Employee benefits: Benefits were increased according to the calculations provided by the Bureau
The overall operating budget decreases by 12.69%. Within the operating budget, no increases or decreases are being requested for travel, supplies and capital assets. Changes within the contractual services budget net to a decrease of 13.48%. The primary changes include: Consulting fees decrease by $20,000 leaving $30,000 for consulting fees for compensation analysis
research services are renewed or replaced depending on price negotiations and availability of better price or quality product.
8
Computer services increasing by $5,668 per expected costs provided by BIT. Legal fees of the Attorney General's office budgeted at $16,000. Have used the legal services of the AG's office for many years, but have agreed to begin paying for their legal assistance, primarily with respect to limited partnership agreements. O Bank fees decreasing by $288,250 In our FY2012 budget, we increased this item in anticipation of a significant increase of our bank custodian fees with BNY/IVlellon. Successful re-negotiations of their fee schedule resulted in a decrease of their fees.
O Provides excellent foundation for stability of South Dakota's professional investment function. O Continues the long-term focus on low unit cost management. O A key ingredient to long-term superior investment performance.
Joint Committee on Appropriations Supplemental Questions
2. What activities are you going to change? Non£
4. With regards to the budget adjustments that occun ed last year, will your agency be able to sustain them on a long-term basis? There is concern about the iong-tenn sustainability of
the compensation adjustments last
13 cornpe-t1.Sation increases
will buy us some time, at le.ast until the planned update to the compensation study in the spring of
2013. 5.
What initiatives for improving efficiency of
intensively to maximize (!fficiencies of investment research, portfolio management and accounting activities. No specific initiatives are planned for FY
13.
6. What are the standards of performance or metrics by which you judge the success and efficiencies of your agency's outcomes? The exhibits in the SDIC presentation illustrate the standards of
peiformance by which we judge the success and efficiencies of
befo1md on pages 12 and 13, and with regard to efficie-r1cies, pages 4 through 7.
amounts contained in the Go e.mor"s FY13 budget? None. SDCL 4-5-30 established process for fonding
following year budget authorization. 11/o fonds are carried over in addition to budget authorization.
8.
What are your plans regarding amending the FY12 General Bill. None. if the Legislature approves a one- time 5% additional compensation payout in FYJ 2, it can be funde.d within the existing budget authorization by using unspent investment incentivefimds ifwe are directl!d to do so. 9.
A_ What reductions in federal programs administered by yam agency, if any, could develop in FY13?
General Funds and/or Other Funds ha e been proposed in lhc Governor's budget lo match any such federal funds at risk? We have no federal programs or funds.
9
SOUTH DAKOTA INVESTMENT COUNCIL FY 20 13 Budget Request
PERSONAL SERVICES Compensation with zero Invest Performance Incentive Total Maximum Potential Incentive Compensation v,rith total max potential Invest Pert I ncent Total Intern, Counc il, Longevity Personal Benefits TOTAL PERSONAL SERVICES OPERATING EXPENSES Contractual Total (see attached tor line item details) Travel Office Supplies & Postage Capital Assets TOTAL OPERATING EXPENSES TOTAL BUDGET REQUEST UNIT COST SUMMARY Internal Expenses as% of Total Assets Internal Expenses as % of Total Assets (with 50% avg Inv Pertroc !) Total Expenses as % of Total Assets
Received FY 2012 3,343,185 2,553,557 5,896,743 17,890 975.770 6,890,403 1,702,210 65,700 12,733 28,242
1,308.885 8,699.288
* Version A: SDI C cone urred with this recommendation at their 12/9111
TP) percentages applied to lowered FY20 12 base compensation, and maximum potential incentives funded at 85%-same as FY2012 (previously always funded at 100%) Version B: Movement tov.rard L TP levels, and maximum potential inc entives funded at 90%
Version A Gov/BFM Recommended' FY 2013
% Change 3,612,529
s_ re%
2,548,621
19%
6,161,151
4-48%
17,890
OJ)J%
1025925
5_14%
7,204,966
4_ 57 %
1,472,742
65,700
0_ 00%
12,733
0_ 00%
28,242
0_ 00%
1,579,417
f9%
8,784,383
0_ 98%
0.080% 0.065% 0.355% Version B Original-SDIC & Ex Brd Approved FY 2013 % Change 3,657,616
9.41%
2,698,540
5.68%
6,356,156
7.79%
20,160
12.W,t;
1 052970
7.Q1%
7,429,286
7.82%
1,471 ,297
73,000
11.1 - 1%
12,733
0.00%
28,242
0.00%
1,585,272
9,014,558
3.62%
0.082% 0.067% 0.357%
10
Version A Versio n B Gov/BFM Original-SD IC & Ex Brd Received Recommended' Approved FY 201 2
~
%Change
~
%Charige OPERATING EXPENSE S Contractual- Investmen t Services CoMulting Services Consulting/Comp Analysis/Asse Allocfotc_
50 000 30,000
00%
30000
00% Subtotal
5 ODO 30,000
00%
30000
00% 1'1vestmen!Accounting, Performance, Benchn arking BNYIM ellDn Performar,c e & Risk Analysis
20,000
100_ 00%
20,000
100.00% S&P 1200
12,000 12,000
0_ 00%
12,000
0.00% S&P 1 00
2,000
100_ 00%
2,000
100.00% S&P USA
10,000
100_ 00%
10,000
100.00% IDC - S&P 1200 - Add'I - ~an free
1 ,ODO
Portia
50,000 50,000
0_ 00%
50,0DO
0.00% Subtotal
72 ODO 94 000
30_ 58%
94 000
30_ 56% 11vestment Databases, Newslee<ls & Quote f ees Bloombe rg
146,475 132,11 1
a·1%
132,11 1
fat ·set 181,632 188,022
1-52%
188,022
3.52% Reuters Fundamental 1'1dex
25,462 26,630
4_ 59%
26,630
4.59% Ooote Fees (inc l. 81oomberg1Factset)
54,086 45,1 25
57%
45,125
57% Dow Jones e· ws Seniic e
34804 42 984
23-50%
42 984
23_ 50~. Subtotal
442.459 434 872
434 872
11vestment Research Services
KDP High Yield
20,000 20,000
0 00%
20,000
0.00% Stone McCartlrf
4,305 4,305
0_ 00%
4,305
0.00% Gin me Credit Fl Research
25,000 25,000
0_ 00%
25,000
0.00% Citigrnup Yield Book I BB Index
10,000 10,000
0_ 00%
10,0DO
0.00% PCS-Wall Street Access & Eurnl)'ean Research
28,350
00%
00,.
PCS-Ameriun 1 ergers 1 ,ODO
a
00%
00% PCS- Asia Paci i c Mergers
11,000
00%
00% C redit Sights
39,900 47,250
18_ 42%
47,250
18A2% lndie esearch-lnsider Sc.ore
14,000 17,640
2!!_00%
17,640
26_ 00% Gerson Lerhman
30,000 30,000
_ 00%
30,0DO
0.00% "1omingstar Equity
44,000 75,000
70-45%
75,000
70_ 45% h.e 1arlrnis.com
13,260 14,233
7-34%
14,233
7.34%
firs! Ra in
16,000
00%
00% Value line
4,100
100_ 00%
4,100
100-00% ,la nag eme n! CV
18,000
00%
flexibility - from 8 rn ke rage to rnd" epe nd ent Resea re h 74 762 150 ODO
1oo e4%
150 ODO
100.84% Subr,otal
358 577 397 528
10_ 8e%
397 528
10_ 86%
Total Contraclllal - Investment
923,036 956,400 H1% 956 ,400
3.81% Contractual - Administrative Office Re
101,542 101,542
0 00%
101,542
0.00% Bondlliabifity hsuraoce
7,020 7,020
0 00%
7,020
Telephone
10,000 10,000
000%
10,0DO
Office Eqt.ip RentaL1 Maintenance
6,000 6,000
0_ 00%
6,000
0.00% Bureau of 11fo & Telecommunications (BIT}
36,036 41 ,704
15_ 73%
40,259
1· 1_ 72% State Central SeMces
8,741 8,741
0_ 00%
8,741
0.00% Legislati,e Audi!
37,135 37,1 35
0_ 00%
37,1 35
0.00% Attorney Generar s Office - Legal Services
16,000
1(1(1_00%
16,000
100.00% Custodial fe- es - Global
538,750 250,500
50%
250,500
~3-50% Seminars/Educational Programs
29,750 33,500
12-6 1%
33,500
12Jj1~~
BL1Siness Pltltications
4.200 4,200
000%
4 200
Total Contracrual - Ad ministrative 779 174 516 342
514 897
CONTRACTUA L TOTAL
1,702,210 1,472,742
1,471 ,297
11
Annualized Total Fund STATE FUND UNIVERSE Ending June 30, 2011
30.0% ..---------------------------------------,
Rate of Ret urn
10/90
25.0%
15.0% 10.0%
0.0%
1 year 2 years 4 years 5 years 10 years 20 years 25 years 38 years Median 21.7% 17.4%
l.8o/o
4.6~;/c, 5.6% 8.4~0 8.6% 8.8%
+sDRSTotal
Fund Ret urn 25.8% 22.2')'ii, 2.1% 5.7% 7.0% 9.7'}0 9.8% 10.6%
0/o Ranking
2 36 7 5
12
INVESTMENT PERFORMANCE PERCENT RETURJ.~S & DOLLARS Retnl'ns
SDRS Total Fund Mellon Analytics Billion $ Corp Plan
% Difference
Capital arket Benchmark
% Difference
State Fund niverse
% Difference
SDRS Beginning FYl 1 Assets SDRS Ending 6/30/ 11 Assets
FY 20 11
19.68% 6.16%
2206%
3.78% 21.70% 4.14%
Dollat:s
7 Years Annualized FY 05 - 11 6.56% 1.24% 6.17% 1.63% 6.20% 1.60%
S6.488 billion S7.926 billion
> Total SDRS dollars earned Fiscal Year 2011 : $1.654 billion > Total SDRS dollars earned last 7 years: > Total SDRS dollars earned last 10 years:
$3.505 billion $4.276 billion
> Extra earnings resulting from last 1, 7 and 10 years of
performance: 1 year 7 years
);,, vs. Mellon A
.nal)iics Corporate: S400 million $713 million
>'" vs. Capital 11farket Benchmark:
S245 million $751 million
>'" vs. State Funds:
S269 million $639 million
10 Years Annualized FY 02 - 11 7.01% 5.93% 1.08% 5.72% 1.29% 5.60% 1.41%
10 years $840 million $828 million $758 million
1/2012 13
5,000 4,000 3,000 2,000 1,000
2011
Potential Excess E arnings
.44%
rns
_.,.._ A
.verage · 0 .S8%
2014
2Q,t7
2020 2023 2026 2029 2032
SDIC outperformance for the last 38 years has been _ 88% annualized versus be nchmark. By the year 2032, a continued .88% outperformance 'M'.luld earn an extra $5.4 billion. Outperformance of even half that amount would make a large difference by additional earnings of $2.6 billion. In contrast, a .88% underperformance would cost lhe retirement systems $4.5 billion relative to average returns. 14
FY 2011 Performance
Compensation & Return-linked Incentive Methodology Review
Large pension fund peer un iverse median return was 19.68% Outperforma nce of 6.16% resulted in $400 mi llion of added value Investment Council's capital market index benchmark return was 22.06% Outperforma nce of 3.78% resulted in $245 million of added value Average added value over the Council's 38 year hist ory is .88% Council long-term return continues to rank 1st for its full history
compensation fo r the Invest ment Officer
cost of living difference and a further 30% diiscount to balance t he desire to get a good deal for South Dakota (through quality results and low cost) with risk of losing the good deal if we cannot keep our people. The discount has increased to more than 40%.
Retaining val ue added staff long term is helpfu l to the Cou ncil sticking 11vith its long term investment strategies during difficult periods Internal staff development model and the ten to twenty year t imeframe for staff to become f ully experienced increases need t o retain staff long term
performance and to retain staff when performance is superior
value and lower when not adding va lue
t he one year to always have something at stake
t hird consisting of an assumed average payout of 50% of base
15
SUMMARY OF TRUST FUND FAIR VALUE AND ASSET ALLOCATION
12/31/2011
(Una dited) Health Care Trust !establish ed Aer il 2001) FY 12 Principal as of 12/31 111
s
85,631,024 Asset Al location Curre t Benchmark Principal as of 12/31 I 11 adjus ed for inflation
s 107,190,656
Global Equi y 52% 52% Fair Value (FV) as of 12/31111
s 101,151,012
Privale Equi y 3"'
,.
2% Real Esta e 11% 6% Di erence - FV less principal
s
15,519,988 Fixed I come-J G 26% 28% Di erenc e - FV less infl. adj. prin.
s
(6,039,644) Fixed I come-HY
2% 5~'ct
Fixed I come-lips 5•'
,o
5% Fiscal year to da e re um
Money .tarnet
a
~
Longterm expected mean return 6.39% Total 100% 100% Payout of 4% plus expec ed inflation of 3% 7.00% Expected return cushion/shortfall
Law allows up to 4% of t e 1 6 quarter a~ge o Distlibution · r FY 13
3,825,385 be distrib ed as long as plinc ipal is not violated Distlibution · r FY 12 (July 1, 2011) 3,876,298 as of December 31 each year
Education Enha ncement Trust j es tab lis hed Aetil 20011 FY 12 Principal as of 12/31 111
s 329,329,930
eis~oj allQi;aJii;io .QJw:[l1
Ei~i:bwa
lll;
Principal as of 12/31 111 adjus ed for inflation
s 412,858,001
Glooo.l Equity 49% 52% Fair Value (FV) as of 12/31111
s 367,821,426
Private Equity 3%
2,~
Real Esta e 12% 6% Di erence - FV less principal
s
38,491,496 Fixed l11come-lG 0%
Di erence - FV less infl. adj. prin.
s (45,036,575)
Fixed l11come-tax ex 32% 30% Fixed I come-HY 2"'
5% Fiscal year to dale return
Fixed Income-lips 1% 3% Longterm expected return oower due to tax exempts) 5.98% Money .tarne 1% 2% Payout of 4% plus expected inflation of 3% 7.00% To al 100% 100% Expected return cushion/shortfall
Law allows up to 4% of tile 1 6 quarter a~ge o Distli but ion - r FY 13
14,052,700 be distlib ed as long as plinc ipal is not ·~elated Distlibution ior FY 12 (July 1, 2011) 14,469,388 as of December 31 each year Qalsgla CilD~Dl ![US ,ii::ilabli:ibs=d B'1!cil Z
!lC
ll FY 12 Principal as of 12/311 11
s 238,000,000
Asset Allocation current B!l.[!Ch!I!all:; Principal as of 12/31 111 adjus ed for inflation
s 305,236,346
Glooo.l Equity 51% 52% Fair Value (FV) as of 12/31111
s 235,771,870
Private Equity 4% 2~,'<t Real Esta e
13%
6% Di er enc e - FV less principal
s
(2,228,130) Fixed l11come-lG
2s:;o,,
;J ,o
28% Di erence - FV less infl. adj. pri ncipal
s (69,464,476)
Fixed lricome-HY 2%
5%,
Fixed I come-lips
5'"
,o
5% Fiscal year to da e re um
Money ,tal1\e
a
2Si
Longterm expected mean return 6.39% Total 100% 100% Payout of 5% plus expec ed inflation of 3% 8.00% Expected return cushion/shortfall
Pays out 5% of a,,erage bata ce with S12 million Distlibution ' r FY 12 (J ne 2012 to Gen. Fund) 12,000,000 minimum paid. Educa ion money distributed as long Distli but ion ' r FY 12 for educ a ion as principal not .;01
a ed as of J ne 30 each year
School & Public Lands lnfla ion protec ion mandaled by Consti u ional Am endmen - (payout is red ced by inflation to ex ent inflatio not ofoset DY realized gains) FY 12 Asset Al location Curre t Benchmark Fair Value as ol 121 31/11
s 181,989,503
Global Equity
51'% ,
52% Privale Equi y 3•'
,.
2% Fiscal year to date re um
Real Esta e 11% 6% Longterm expected mean return 6.39% Fixed I come-J G 25% 28% Fixed lncome-non-mk 1•'
lO
D"s ributio for FY 12 (Feb 1, 2012to K-12)
7,433,191 Fixed I come-HY 2•'
,.
5%
ffs ribution for FY 1 to Board of Regen s (EST)
1 ,soo,000
Fixed I come-Tips
5%
5% TOTAL 8,933,191 Money ,i al1\e
3'"
Total 100% 100% 16