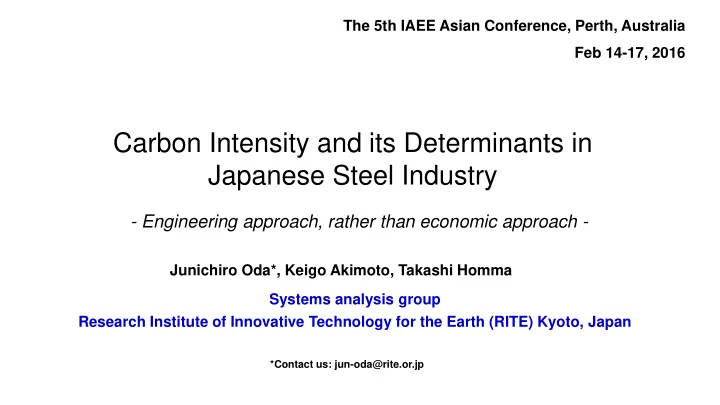
SLIDE 14 29.6% 29.2% 26.7% 25.4% 24.2% 24.5% 25.0% 23.9% 23.3% 21.6% 19.2% 20.5% 21.0% 21.9% 21.2% 8.7% 9.6% 9.0% 10.2% 11.0% 12.0% 11.4% 12.2% 14.5% 13.1% 12.9% 13.0% 11.8% 11.0% 11.2% 13.2% 13.8% 14.7% 13.3% 13.5% 11.8% 12.6% 13.6% 12.7% 16.2% 15.7% 15.5% 17.7% 17.9% 18.8% 9.4% 8.9% 9.2% 9.6% 9.5% 9.0% 8.8% 8.5% 8.5% 10.0% 10.1% 9.3% 8.7% 8.6% 8.3% 16.8% 16.1% 16.8% 17.3% 17.0% 17.1% 17.0% 17.0% 16.4% 16.7% 16.7% 16.1% 16.1% 15.6% 15.1% 6.2% 6.1% 5.5% 5.5% 5.7% 5.7% 5.6% 5.5% 5.6% 4.5% 4.6% 4.7% 4.9% 4.9% 4.8% 2.6% 2.9% 2.9% 3.0% 2.7% 2.5% 2.7% 2.6% 2.4% 2.7% 2.7% 2.6% 2.5% 2.5% 2.6% 5.8% 5.6% 6.4% 6.9% 7.2% 7.9% 7.6% 7.9% 7.4% 6.7% 8.2% 8.5% 7.9% 8.2% 8.3% 3.0% 3.5% 4.2% 4.2% 4.3% 4.4% 4.6% 4.4% 4.6% 4.4% 5.2% 5.1% 5.4% 5.2% 5.5% 3.2% 3.0% 3.3% 3.4% 3.5% 3.5% 3.2% 3.0% 2.9% 2.8% 3.2% 3.2% 2.7% 2.8% 2.8% 0% 10% 20% 30% 40% 50% 60% 70% 80% 90% 100% FY00 FY02 FY04 FY06 FY08 FY10 FY12 FY14 Share of final steel products (%) 26-29,31. Other special steel
24,25. Structural steel 21-23. Tool steel
18,19. Special pipe 16,17. Ordinary pipe 12-14',15. Coated sheet, coil 10,11. Cold rolled sheet , coil 9,9'. Hot rolled coil 7,7',8. Hot rolled plate, sheet 1-6. Long products
Ordinary steel (20) Special steel (14)
3.4 Downstream production process (2/2)
14
We aggregated steel products (about 45 steel products by METI stat. and about 620 steel products by Trade Stat.) into 34 categories
Capacity factor index (x1) Production process index (x2): Upstream, Downstream