ISS TRAINING & EDUCATION SERVICES PROJECT (ITESP) OVERVIEW The - - PDF document

iss training education services project itesp
SMART_READER_LITE
LIVE PREVIEW

ISS TRAINING & EDUCATION SERVICES PROJECT (ITESP) OVERVIEW The - - PDF document

ISS TRAINING & EDUCATION SERVICES PROJECT (ITESP) OVERVIEW The Defence Core Network Services (DCNS) programme was established to develop and deliver a portfolio of Information Communications Technology (ICT) services that are cheaper, better


slide-1
SLIDE 1

ISS TRAINING & EDUCATION SERVICES PROJECT (ITESP)

OVERVIEW

Enhanced or Sustained T&E Business Effectiveness

“Timely provision

  • f

appropriately trained and motivated personnel”

“Timely provision” defined as when Supply

  • f trained personnel is matched with

Demand from the wider business “Appropriately trained” defined as “Posessing the knowledge, skills, experience and attitudes required to undertake the role required within the business”

  • B2. Improved

course pass rates

  • B3. Improved

Student Retention rates

  • B8. Improved timescales

associated with adding new course material

  • I9. Quality of ICT provision

better matched to student’s expectations

  • B1. Improved

student feedback scores

  • I7. Improved proportion of

training material accessible on line/off site

  • I4. Improved timescales

associated with implementing non-BAU ICT change

  • I2. Improved timescales

associated with implementing BAU changes (e.g. new users)

  • B7. Improved timescales

associated with adding capacity to existing courses

  • O1. T&E Core Scope

using ITESP ICT provided in day-day business End Benefit Interim Benefit Output or Outcome

KEY

  • B4. Training pipeline
  • utputs maintained
  • B6. Less time “lag”

between fielded systems and training systems Reduced

  • perational risk

Reduced time required to provide “on the job” training

  • B5. Improved ability to

spot and manage long term demand trends I1.Improved user access to Training Management applications

  • I3. Improved ability to

develop new (interactive) courseware

  • I5. Improved network

connectivity between Training communities

  • I6. Improved access to
  • nline forums enabling

sharing of training best practice

  • I10. Improved incident

resolution times

  • I11. Improved

availability

  • B9. Faster ability to

change HOW training is delivered

NON-FINANCIAL BENEFITS MAP

The outputs of the ITESP project lead to outcomes that enable the overall strategic objective agreed with the stakeholder community: “The timely provision of appropriately trained and motivated personnel” A benefit is a measurable improvement that contributes to the strategic

  • bjective. No single measurement fully covers this objective.

We agreed on measurable Business Benefits with business SMEs to describe what the options offer in terms of non financial benefits that together enable the objective. The Business Benefits are enabled in part by the solution’s technical characteristics. Measureable Interim Benefits were defined to describe the technical qualities of the options (e.g. availability). These enable Business Benefits above a certain threshold.

NON-FINANCIAL BENEFITS ANALYSIS APPROACH

  • Interim Benefits Assessment (Workshop 1)
  • Workshop with technical SMEs from each TLB
  • Score ICT performance of each option against Interim Benefits
  • Business Benefits Assessment (Workshop 2)
  • Workshop with business SMEs from each TLB
  • Score current business performance and determine the threshold

performance

  • Application of Analysis Rules
  • Combine output from Workshop 1 & 2
  • Apply a series of rules to produce a Business Benefits RAG status for
  • ptions
  • Option 2: Do Minimum
  • Extend/re-compete existing contract
  • Option 3: Best of Breed
  • Use best examples of systems currently in use
  • Option 4: New Service
  • New Training system procured using ITESP catalogue
  • Option 4a: ‘Local’ (Big Bang)
  • Option 4b: ‘Remote’ (Big Bang)
  • Option 4c: ‘Local’ (Phased)
  • Option 4d: ‘Remote’ (Phased)
  • Option 5: Hybrid
  • “Middle ground” between 4a and 4b
  • On-site SIAM and desktop support arrangements
  • Blend of more and less costly architectures (e.g. thick and thin client)

Technical representative 1 Option 1 Interim Benefit 1: 90% Interim Benefit 2: 3 days Interim Benefit 3: 20% Interim Benefit 4: 40 days Option 2 Interim Benefit 1: 90% Interim Benefit 2: 3 days Interim Benefit 3: 20% Interim Benefit 4: 40 days Option 3 Interim Benefit 1: 90% Interim Benefit 2: 3 days Interim Benefit 3: 20% Interim Benefit 4: 40 days Technical representative 2 Option 1 Interim Benefit 1: 90% Interim Benefit 2: 3 days Interim Benefit 3: 20% Interim Benefit 4: 40 days Option 2 Interim Benefit 1: 90% Interim Benefit 2: 3 days Interim Benefit 3: 20% Interim Benefit 4: 40 days Option 3 Interim Benefit 1: 80% Interim Benefit 2: 20 days Interim Benefit 3: 10% Interim Benefit 4: 50 days Technical representative 3 Option 1 Interim Benefit 1: 90% Interim Benefit 2: 3 days Interim Benefit 3: 20% Interim Benefit 4: 40 days Option 2 Interim Benefit 1: 90% Interim Benefit 2: 3 days Interim Benefit 3: 20% Interim Benefit 4: 40 days Option 3 Interim Benefit 1: 40% Interim Benefit 2: 6 days Interim Benefit 3: 25% Interim Benefit 4: 30 days Business representative 1 Option 1 Interim Benefit 1: 90% Interim Benefit 2: 3 days Interim Benefit 3: 20% Interim Benefit 4: 40 days Option 2 Interim Benefit 1: 90% Interim Benefit 2: 3 days Interim Benefit 3: 20% Interim Benefit 4: 40 days Option 3 Interim Benefit 1: Interim Benefit 2: Interim Benefit 3: Interim Benefit 4: Business representative 2 Option 1 Interim Benefit 1: 90% Interim Benefit 2: 3 days Interim Benefit 3: 20% Interim Benefit 4: 40 days Option 2 Interim Benefit 1: 90% Interim Benefit 2: 3 days Interim Benefit 3: 20% Interim Benefit 4: 40 days Option 3 Interim Benefit 1: Interim Benefit 2: Interim Benefit 3: Interim Benefit 4: Business representative 1 Option 1 Interim Benefit 1: 90% Interim Benefit 2: 3 days Interim Benefit 3: 20% Interim Benefit 4: 40 days Option 2 Interim Benefit 1: 90% Interim Benefit 2: 3 days Interim Benefit 3: 20% Interim Benefit 4: 40 days Option 3 Business Benefit 1: Business Benefit 2: Business Benefit 3: Business representative 2 Option 1 Interim Benefit 1: 90% Interim Benefit 2: 3 days Interim Benefit 3: 20% Interim Benefit 4: 40 days Option 2 Interim Benefit 1: 90% Interim Benefit 2: 3 days Interim Benefit 3: 20% Interim Benefit 4: 40 days Option 3 Business Benefit 1: Business Benefit 2: Business Benefit 3: Combined View Option 1 Interim Benefit 1: 90% Interim Benefit 2: 3 days Interim Benefit 3: 20% Interim Benefit 4: 40 days Option 2 Interim Benefit 1: 90% Interim Benefit 2: 3 days Interim Benefit 3: 20% Interim Benefit 4: 40 days Option 3 Business Benefit 1: Business Benefit 2: Business Benefit 3: Option ranking Ranking order 1. Option 3 2. Option 1 3. Option 2

C D E A B

OPTIONS DEFINITION

B2 B3 B4 B5 B6 B2 B3 B4 B5 B6 B2 B3 B4 B5 B6 B2 B3 B4 B5 B6 B2 B3 B4 B5 B6 B1 B7 B8 B1 B7 B8 B1 B7 B8 B1 B7 B8 B1 B7 B8 High Priority Low Priority

Option 2 Option 3 Option 4a/c Option 4b/d Option 5

OPTION SCORES

RAG scores are created for each Business Benefit, for each option, for each FLC community, based on the application of the analysis rules applied to the data provided by FLC SMEs. The Defence Core Network Services (DCNS) programme was established to develop and deliver a portfolio of Information Communications Technology (ICT) services that are cheaper, better integrated and more flexible, delivering MOD’s core ICT capability; from videoconferencing and satellites to desktop PCs and mobile phones. In line with the Government ICT Strategy, MOD is looking to implement a coordinated multi-vendor service delivery model, introducing more competition, contracting for shorter and smaller value contracts than at present and utilising up to date Government contracting mechanisms. ITESP is one project within the DCNS programme. The Information Systems and Services (ISS) Training & Education Services Project (ITESP) was initially set up to generate savings by rationalising spend on Training & Education (T&E) ICT infrastructure across Defence. The project is responsible for establishing the most cost-effective future solution in support of Defence training. The four core stakeholder groups in scope are: Air Training Information Infrastructure Project (ATTIP), Navy Training Information Infrastructure Project (NTIIP), Army Recruitment and Training Division Classrooms Information Infrastructure Project (ACIIP) and Defence Technical Training Change Programme (DTTCP). The COEIA activity performed in support of this project comprised non-financial benefits assessment, an Investment Appraisal and consideration of other contributory factors (OCFs) for each option.

slide-2
SLIDE 2

RULE 0

Option 2 Option 2 Option 3 Option 3 Metrics Min Max Min Max I1-M1 0.30 0.30 0.30 0.3 I2-M1 1.00 6.00 2.00 5.0 I2-M2 5.00 20.00 2.00 20.0 I2-M3 2.00 3.00 2.00 5.0 I3-M1 20.00 60.00 20.00 60.0 I4-M1 30.00 90.00 20.00 90.0 I4-M2 7.00 30.00 7.00 30.0 doesn’t interfere with given weightings when only some of the weightings are missing, the number must be very small. We have therefore taken the number to be the lowest weighting from that judge divided by 1000. Option 2 Option 2 Option 2 Option 2 Option 2 Option 2 Option 3 Optio Judge 1 Judge 1 Judge 2 Judge 2 Judge 3 Judge 3 Judge 1 Judge Metrics Min Max Min Max Min Max Min Max I1-M1 0.30 0.30 0.30 0.30 0.30 0.30 0.30 I2-M1 1.00 6.00 2.00 5.00 2.00 2.00 2.00 I2-M2 5.00 20.00 10.00 10.00 5.00 20.00 5.00 I2-M3 3.00 3.00 2.00 3.00 2.00 3.00 2.00 I3-M1 20.00 20.00 20.00 60.00 20.00 60.00 20.00 I4-M1 30.00 90.00 30.00 90.00 30.00 90.00 30.00 I4-M2 7.00 30.00 7.00 30.00 7.00 30.00 7.00 doesn’t interfere with given weightings when only some of the weightings are missing, the number must be very small. We have therefore taken the number to be the lowest weighting from that judge divided by 1000.

Rule 0 transforms the data from workshop 1 into a consolidated range for each Interim Benefit. The range of values for the Interim Benefits taken from maximum and minimum scores from the technical judges in Workshop 1. This rule calculates a RAG score for each Interim Benefit Metric. Red if the Interim Metric always below the threshold. Amber if the Interim Metric is sometimes below the threshold. Green if the Interim Metric is never below the threshold.

Interim benefit metric I1 – M1 I2 – M1 I2 – M2 Score (Panel 1) 65% 5-20 days 2-3 days Threshold (Panel 2) 10% 5-10 days 1 day Assessment (score

  • vs. threshold)

G A R

Rule 1

ANALYSIS RULES

NON-FINANCIAL BENEFITS ANALYSIS

Rules 1 and 2 produce Business Benefit RAGs for each Stakeholder. This rule aggregates the Business Benefit RAGs into an Overall Business Benefit RAG across all Business Stakeholders. The overall Business Benefit RAG is the lowest Business Benefit RAG across all business stakeholders.

Assessment (stakeholder 1)

G A R

Rule 3

Assessment (stakeholder 2)

A A G

Assessment (stakeholder 3)

R A G

Business benefit B1 B2 B3 Overall assessment

R A R G G G

B4

G

RULE 3

Business Benefits link to multiple Interim Metrics. This rule calculates Business Benefit RAGs from Interim Benefit RAGs.

  • The Business Benefit RAG is the

Interim Benefit RAG with the largest weighting (from Workshop 2).

  • If weightings are equal, the lowest

RAG is assigned.

G A R G

Score with largest proportion is assigned If all equal, lowest score is assigned Where some metrics have not been scored, these are discounted

G

RULE 2

Rule 3 produced RAGs for each Business Benefit for each option. Rule 4 presents these RAGs in a pie chart. The segment size is equal to the average Business Benefit Weighting. The Business Benefit RAG segment size is equal to the average Business Benefit weighting across stakeholders.

Low Priority High Priority Option 2 Option 3 Option 4a/4c Option 4b/4d Option 5

B1 B2 B3 B4 B7 B8 B1 B2 B3 B4 B7 B8 B1 B2 B3 B4 B7 B8 B1 B2 B3 B4 B7 B8 B1 B2 B3 B4 B7 B8 B5 B6 B5 B6 B5 B6 B5 B6 B5 B6

RULE 4

In this rule, Options are ranked by the following in descending order of importance. In each case, lower is better:

  • The total weight of high priority Red Business Benefits.
  • The total weight of high priority Amber Business Benefits.
  • The total weight of low priority Red Business Benefits.
  • The total weight of low priority Amber Business Benefits.

RULE 5

We prepared a series of rules to transform the raw data collected at SME workshops into a series of RAG scores for each Business Benefit. This process was repeated for each option and for each community in the scope of ITESP. We carried out a series of sensitivity tests in which variants of the rules were applied to ensure that the choice of rule did not influence the result.

RULE 1

Business benefit B2 Associated interim benefit metrics B1 I9 – M1 I6 – M1 I7 – M1 Weighting (stakeholder 1) Weighting (stakeholder 2) 10% 10% 90% 20% 10% 50%

Rule 4

Average business benefit weighting 15% 80% Overall assessment

A R

Low Priority High Priority Option 2 Option 3 Option 4a/4c Option 4b/4d Option 5 B1 B2 B3 B4 B7 B8 B1 B2 B3 B4 B7 B8 B1 B2 B3 B4 B7 B8 B1 B2 B3 B4 B7 B8 B1 B2 B3 B4 B7 B8 B5 B6 B5 B6 B5 B6 B5 B6 B5 B6

1 1 4 3 5

slide-3
SLIDE 3

NON-FINANCIAL BENEFITS ANALYSIS

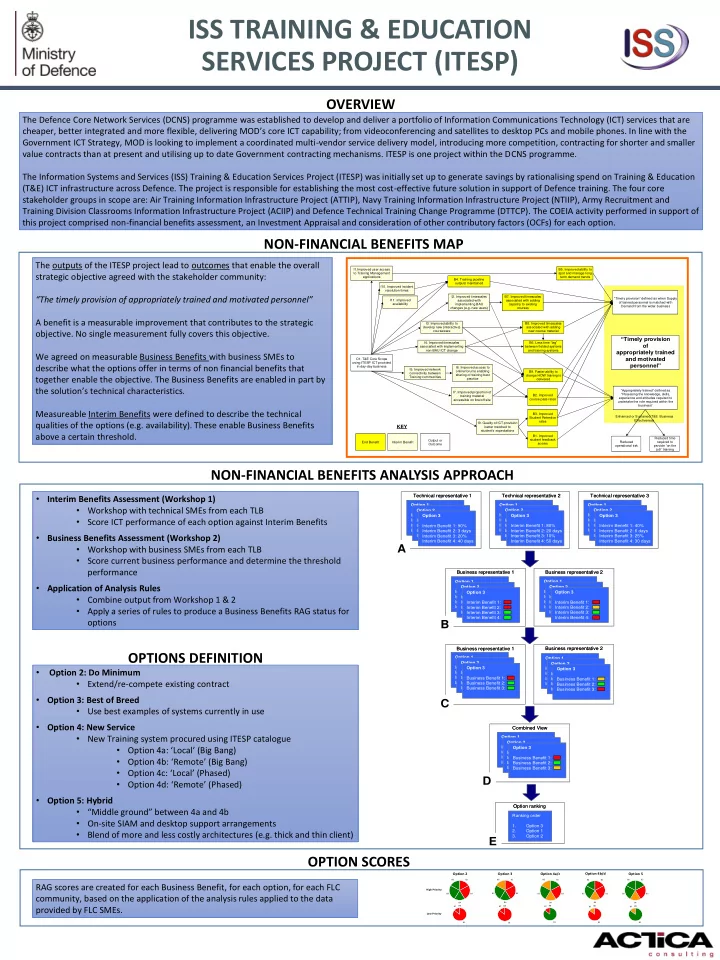
BENEFITS SCORING MODEL

B3 B7 B8 B3 B7 B8 B3 B7 B8 B3 B7 B8 B3 B7 B8 B1 B2 B4 B5 B6 B1 B2 B4 B5 B6 B1 B2 B4 B5 B6 B1 B2 B4 B5 B6 B1 B2 B4 B5 B6 High Priority Low Priority

Option 2 Option 3 Option 4a/c Option 4b/d Option 5

B2 B4 B5 B6 B7 B8 B2 B4 B5 B6 B7 B8 B2 B4 B5 B6 B7 B8 B2 B4 B5 B6 B7 B8 B2 B4 B5 B6 B7 B8 B1 B3 B1 B3 B1 B3 B1 B3 B1 B3 High Priority Low Priority

Option 2 Option 3 Option 4a/c Option 4b/d Option 5

B1 B2 B3 B4 B7 B8 B1 B2 B3 B4 B7 B8 B1 B2 B3 B4 B7 B8 B1 B2 B3 B4 B7 B8 B1 B2 B3 B4 B7 B8 B5 B6 B5 B6 B5 B6 B5 B6 B5 B6 High Priority Low Priority

Option 2 Option 3 Option 4a/c Option 4b/d Option 5

B2 B3 B4 B5 B6 B2 B3 B4 B5 B6 B2 B3 B4 B5 B6 B2 B3 B4 B5 B6 B2 B3 B4 B5 B6 B1 B7 B8 B1 B7 B8 B1 B7 B8 B1 B7 B8 B1 B7 B8 High Priority Low Priority

Option 2 Option 3 Option 4a/c Option 4b/d Option 5 Business benefit Option 2 Option 3 Option 4a/c Option 4b/d Option 5 Remarks

  • B1. Improved student

feedback scores R R G R G Business SMEs required a solution that can meet 50% of the students’ ICT quality expectations. Technical SMEs felt that improved access to the internet would improve the performance.

  • B2. Improved course pass

rates R R G R G The business SMEs require 100% of staff and trainees having access to rich content, RLI and VLEs. According to the technical SMEs, this level of accessibility would only be available under Options 4a/c and 5. The key differentiator is the level of access to VLEs outside a formal classroom (I7), which the SMEs scored very poorly for Options 2 and 4b/d (5%); Option 3 would only deliver moderate accessibility according to the technical SMEs.

  • B3. Improved student

retention rate R R R R R The business SMEs have a high expectation of ICT

  • quality. According to SMEs’ scoring of the options,

there is no option that could meet the desired performance.

  • B4. Training pipeline outputs

maintained G G A A A Under the New Catalogue Service options (Options 4a-d and Option 5), the view from the technical SMEs was that the use of multiple contracts and added system complexity could result in longer incident resolution times and, possibly, reduced

  • availability. The degree of uncertainty documented

in the evaluation of Options 4a/c, 4b/d and 5, has therefore resulted in an AMBER score for this benefit.

  • B5. Improved ability to spot

and manage long term demand trends G G G G G

  • B6. Reduced time lag

between new systems being fielded and representative training systems being available G A A G G The technical SMEs stated that Options 3 and 4a/c provided a solution that had increased complexity compared with the other solutions. The thin client

  • nly Option (4b/d) was described as enabling simple

deployment and easy peripheral integration capabilities.

  • B7. Improved timescales

associated with adding capacity to existing courses R R R A A There was some uncertainty among the technical SMEs as to the potential complexity of the system in Options 4a/c, 4b/d and 5. This resulted in there being a mixture in the performance evaluation. The SMEs estimated it could take slightly longer to add a new user (I2-M1) under Options 4b/d and 5, whereas it would take slightly longer to provide the necessary permissions to users (I2-M3) under Options 4a/c and 5. Options 4a/c, 4b/d and 5 were estimated to reduce the time it took to add a new EUD (I2-M2).

  • B8. Improved timescales

associated with adding new course material

  • Data was not returned.

ACIIP RESULTS

Business benefit Option 2 Option 3 Option 4a/c Option 4b/d Option 5

  • B1. Improved student feedback scores

G G G G G

  • B2. Improved course pass rates

G G G G G

  • B3. Improved student retention rate

G G G G G

  • B4. Training pipeline outputs maintained

G G G G G

  • B5. Improved ability to spot and manage

long term demand trends

  • B6. Reduced time lag between new systems

being fielded and representative training systems being available G G G G G

  • B7. Improved timescales associated with

adding capacity to existing courses G G G G G

  • B8. Improved timescales associated with

adding new course material G G G G G

ATIIP RESULTS

Business benefit Option 2 Option 3 Option 4a/c Option 4b/d Option 5 Remarks

  • B1. Improved student

feedback scores R R R R R The overall opinion from the technical SMEs was that no option will improve the % of students who think the ICT quality is at least as good as their own, above the baseline 50% for the current solution. Business SMEs have stated that 70% is the desired threshold.

  • B2. Improved course pass

rates G G G G G

  • B3. Improved student

retention rate R R R R R B1 and B3 are both dependent on the same Interim

  • Benefits. The threshold set by the business SMEs is

again higher than current performance. As no option is expected to increase the performance, according to technical SMEs, no option can meet the business SMEs’ expectations.

  • B4. Training pipeline outputs

maintained R R R R R B4 is linked to the availability of the ICT system. The availability is currently at 99% and one of the business SMEs has set the threshold at 100%, whereas the other SME determined current availability as satisfactory. As the level of availability is overall estimated to possibly decrease for Options 4a/c, 4b/d and 5, no option meets the 100% availability criteria. The Business Benefit score is therefore RED due to our approach pulling out the lowest score across all SMEs.

  • B5. Improved ability to spot

and manage long term demand trends G G G G G

  • B6. Reduced time lag between

new systems being fielded and representative training systems being available A A A A A One of the business SMEs has set the threshold for the time it takes to integrate a new application at 30

  • days. According to the technical SMEs this timescale

does not vary between options, but the time is application-dependent, ranging from 2-40 days. The analysis outcome for all the options is therefore AMBER.

  • B7. Improved timescales

associated with adding capacity to existing courses A A A A A Under Options 4a/c, 4b/d and 5, multiple contracts will be procured and managed under a SIAM. There was concern over what the contract management process will look like and the processes involved in carrying out change requests. The added complexity was therefore anticipated by the technical SMEs to increase the change timescales. However, although Options 2 and 3 scored slightly better, the business SME’s thresholds were not fully met in each case.

  • B8. Improved timescales

associated with adding new course material A A A A A The end to end timescales for developing and implementing new courseware varies hugely according to the technical SMEs (10 days to 2 years), but the option capabilities do not influence this

  • timescale. However, one of the business SMEs has

stated this should not exceed 1 year, resulting in all

  • ptions scoring AMBER.

NTIIP RESULTS

Business benefit Option 2 Option 3 Option 4a/c Option 4b/d Option 5 Remarks

  • B1. Improved student

feedback scores R R G R G Currently the service, devices and access is very

  • poor. Therefore Option 2 scores badly. Option 3 is

also seen as not being good enough to boost the students’ impression of the T&E ICT. Option 4b/d scores badly because the technical SME opinion is that thin client devices would not meet the expectations of the students.

  • B2. Improved course pass

rates R G G R G Improved course pass rates are linked to Interim Benefits I6 (improved access to online forums) and I7 (improved proportion of training material available on line/off-site). This is a high priority for DTTCP and under Options 2 and 4b/d the level of access to rich content/RLI and the VLE (DLMC) was deemed insufficient by technical SMEs.

  • B3. Improved student

retention rate R G G G G The business SMEs agreed there is a link between the T&E ICT quality and the student retention rate. As the current ICT provision is very poor, Option 2 would not support an improvement in the current student retention rate.

  • B4. Training pipeline outputs

maintained G R R R R Maintaining the training pipeline output is linked to the availability of the T&E system. Under the

  • ptions where a new solution will be implemented,

there was concern that the added complexity of the new system will very slightly reduce this level of availability compared to legacy arrangements. However the business threshold was set equal to the legacy score and so all other options scored RED.

  • B5. Improved ability to spot

and manage long term demand trends G G G G G

  • B6. Reduced time lag

between new systems being fielded and representative training systems being available G G G A G There is a reduced level of on-site support under Option 4b/d, which is expected to increase the time it would take to integrate new peripherals to the system.

  • B7. Improved timescales

associated with adding capacity to existing courses A G G G G B7 is linked to the timescales for carrying out ‘Business as Usual’ changes. For I2-M1, the average time required to add a new user, only Option 2 did not meet the threshold.

  • B8. Improved timescales

associated with adding new course material A A G A G The business SMEs’ threshold is more demanding than the current performance range of the system and the best of breed solution. Options 2 and 3 therefore score an AMBER rating. Option 4b/d is expected by technical SMEs to increase the time it takes to develop and deploy courseware, but the timescale is still partially overlapping with the threshold timescales. As for the evaluation of B6, the time it takes to integrate peripherals is also anticipated to be slightly longer than current timescales.

DTTCP RESULTS

Workshop 1 Rule 0 Option 2 Option 2 Option 2 Option 2 Option 2 Option 2 Option 3 Option 3 Option 3 Option 3 Option 3 Option 3 Option 4a Option 4a Option 4a Option 4a Option 4a Option 4a Option 4b Option 4b Option 4b Option 4b Option 4b Option 4b Option 5 Option 5 Option 5 Option 5 Option 5 Option 5 Judge 1 Judge 1 Judge 2 Judge 2 Judge 3 Judge 3 Judge 1 Judge 1 Judge 2 Judge 2 Judge 3 Judge 3 Judge 1 Judge 1 Judge 2 Judge 2 Judge 3 Judge 3 Judge 1 Judge 1 Judge 2 Judge 2 Judge 3 Judge 3 Judge 1 Judge 1 Judge 2 Judge 2 Judge 3 Judge 3 Option 2 Option 2 Option 3 Option 3 Option 4a Option 4a Option 4b Option 4b Option 5 Option 5 Metrics Min Max Min Max Min Max Min Max Min Max Min Max Min Max Min Max Min Max Min Max Min Max Min Max Min Max Min Max Min Max Metrics Min Max Min Max Min Max Min Max Min Max I1-M1 0.30 0.30 0.30 0.30 0.30 0.30 0.30 0.30 0.30 0.30 0.30 0.30 0.50 0.50 0.50 0.50 0.50 0.50 0.30 0.30 0.30 0.30 0.30 0.30 0.50 0.50 0.50 0.50 0.50 0.50 I1-M1 0.30 0.30 0.30 0.30 0.50 0.50 0.30 0.30 0.50 0.50 I2-M1 1.00 6.00 2.00 5.00 2.00 2.00 2.00 5.00 2.00 5.00 2.00 5.00 1.00 2.00 1.00 2.00 1.50 1.50 2.00 2.00 2.00 5.00 2.00 2.00 1.00 2.00 1.00 2.00 1.50 1.50 I2-M1 1.00 6.00 2.00 5.00 1.00 2.00 2.00 5.00 1.00 2.00 I2-M2 5.00 20.00 10.00 10.00 5.00 20.00 5.00 15.00 2.00 15.00 5.00 20.00 3.00 5.00 3.00 5.00 3.00 5.00 1.00 3.00 1.00 3.00 1.00 2.00 2.00 4.00 2.00 4.00 2.00 4.00 I2-M2 5.00 20.00 2.00 20.00 3.00 5.00 1.00 3.00 2.00 4.00 I2-M3 3.00 3.00 2.00 3.00 2.00 3.00 2.00 5.00 2.00 5.00 2.00 5.00 2.00 3.00 2.00 2.00 1.00 2.00 2.00 3.00 2.00 3.00 1.00 2.00 2.00 3.00 2.00 3.00 1.00 2.00 I2-M3 2.00 3.00 2.00 5.00 1.00 3.00 1.00 3.00 1.00 3.00 I3-M1 20.00 20.00 20.00 60.00 20.00 60.00 20.00 20.00 20.00 60.00 20.00 60.00 15.00 20.00 15.00 20.00 20.00 60.00 30.00 30.00 30.00 80.00 20.00 60.00 15.00 20.00 15.00 20.00 20.00 60.00 I3-M1 20.00 60.00 20.00 60.00 15.00 60.00 20.00 80.00 15.00 60.00 I4-M1 30.00 90.00 30.00 90.00 30.00 90.00 30.00 90.00 30.00 90.00 20.00 80.00 7.00 45.00 15.00 45.00 15.00 45.00 7.00 22.50 7.00 22.00 7.00 20.00 7.00 45.00 15.00 45.00 10.00 40.00 I4-M1 30.00 90.00 20.00 90.00 7.00 45.00 7.00 22.50 7.00 45.00 I4-M2 7.00 30.00 7.00 30.00 7.00 30.00 7.00 30.00 7.00 30.00 7.00 30.00 5.00 15.00 5.00 15.00 5.00 15.00 10.00 40.00 10.00 40.00 10.00 40.00 7.00 30.00 7.00 30.00 7.00 30.00 I4-M2 7.00 30.00 7.00 30.00 5.00 15.00 10.00 40.00 7.00 30.00 I6-M1 0.00 0.00 0.00 0.00 0.00 0.00 0.80 0.80 0.80 0.80 0.80 0.80 1.00 1.00 1.00 1.00 1.00 1.00 1.00 1.00 1.00 1.00 1.00 1.00 1.00 1.00 1.00 1.00 1.00 1.00 I6-M1 0.00 0.00 0.80 0.80 1.00 1.00 1.00 1.00 1.00 1.00 I7-M1 0.00 0.00 0.00 0.00 0.00 0.00 0.80 0.80 0.80 0.80 0.80 0.80 1.00 1.00 1.00 1.00 1.00 1.00 0.00 0.00 0.00 0.00 0.00 0.00 1.00 1.00 1.00 1.00 1.00 1.00 I7-M1 0.00 0.00 0.80 0.80 1.00 1.00 0.00 0.00 1.00 1.00 I9-M1 0.10 0.10 0.10 0.10 0.10 0.10 0.40 0.40 0.40 0.40 0.40 0.40 0.80 0.80 0.80 0.80 0.80 0.80 0.60 0.60 0.60 0.60 0.50 0.50 0.80 0.80 0.80 0.80 0.80 1.00 I9-M1 0.10 0.10 0.40 0.40 0.80 0.80 0.50 0.60 0.80 1.00 I10-M1 1.00 1.00 1.00 1.00 1.00 1.00 1.00 1.00 1.00 1.00 1.00 1.00 0.50 0.50 0.50 0.50 0.50 0.50 0.75 0.75 0.75 0.75 0.75 0.75 0.63 0.63 0.63 0.63 0.63 0.63 I10-M1 1.00 1.00 1.00 1.00 0.50 0.50 0.75 0.75 0.63 0.63 I11-M1 0.99 0.99 0.99 0.99 0.99 0.99 0.95 0.95 0.96 0.96 0.96 0.96 0.98 0.98 0.98 0.98 0.98 0.98 0.95 0.95 0.96 0.96 0.96 0.96 0.97 0.97 0.97 0.97 0.97 0.97 I11-M1 0.99 0.99 0.95 0.96 0.98 0.98 0.95 0.96 0.97 0.97 Workshop 2 Rule 1 Rule 2 These figures are taken directly from workshop 1. These calculations apply rule 1 to the data captured in workshop 1 and 2 REVIEW: Judge 1 Judge 1 Judge 1 Judge 2 Judge 2 Judge 2 Judge 3 Judge 3 Judge 3 Business Benefit Thresholds Interim Benefit Scores Option score is "DMC" when the information was not collected. Option score is "N/A" if the user has estimated the ICT impact to the benefit as 0%. Benefit Benefit Threshold Threshold Threshold Threshold Threshold Threshold Judge 1 Judge 1 Judge 1 Option 2 Option 2 Option 2 Option 3 Option 3 Option 3 Option 4a Option 4a Option 4a Option 4b Option 4b Option 4b Option 5 Option 5 Option 5 DNC' weight 0.01 Business Priority Interim Units Min Max Weight Min Max Weight Min Max Weighting Min Max Weight Min Max Score Min Max Score Min Max Score Min Max Score Min Max Score B1 High I9-M1 % 0.70 0.70 10.00 0.10 0.10 10.00 0.10 0.10 10.00 0.70 0.70 10.00 0.10 0.10 1 0.40 0.40 1 0.80 0.80 3 0.50 0.60 1 0.80 1.00 3 B2 High I6-M1 % 0.60 0.60 40.00 N/K N/K 20.00 0.00 0.00 70.00 0.60 0.60 40.00 0.00 0.00 1 0.80 0.80 3 1.00 1.00 3 1.00 1.00 3 1.00 1.00 3 Option 2 Option 2 Option 2 Option 2 Option 3 Option 3 Option 3 Option 3 Option 4a Option 4a Option 4a Option 4a Option 4b Option 4b Option 4b Option 4b Option 5 Option 5 Option 5 Option 5 B2 High I7-M1 % 0.60 0.60 50.00 0.40 0.40 70.00 0.40 0.40 20.00 0.60 0.60 50.00 0.00 0.00 1 0.80 0.80 3 1.00 1.00 3 0.00 0.00 1 1.00 1.00 3 R A G Score R A G Score R A G Score R A G Score R A G Score B3 High I9-M1 % 0.40 0.40 40.00 0.40 0.40 50.00 0.10 0.10 10.00 0.40 0.40 40.00 0.10 0.10 1 0.40 0.40 3 0.80 0.80 3 0.50 0.60 3 0.80 1.00 3 Benefit 1 2 3 1 2 3 1 2 3 1 2 3 1 2 3 B4 High I10-M1 Days 1.00 1.00 35.00 1.00 1.00 1.00 1.00 1.00 5.00 1.00 1.00 35.00 1.00 1.00 3 1.00 1.00 3 0.50 0.50 3 0.75 0.75 3 0.63 0.63 3 B1 10 1 10 1 10 3 10 1 10 3 B4 High I11-M1 % 0.99 0.99 60.00 0.99 0.99 97.00 0.99 0.99 5.00 0.99 0.99 60.00 0.99 0.99 3 0.95 0.96 1 0.98 0.98 1 0.95 0.96 1 0.97 0.97 1 B2 90 1 90 3 90 3 50 40 1 90 3 B5 Low I1-M1 % 0.10 0.10 80.00 0.30 0.30 30.00 0.30 0.30 30.00 0.10 0.10 80.00 0.30 0.30 3 0.30 0.30 3 0.50 0.50 3 0.30 0.30 3 0.50 0.50 3 B3 40 1 40 3 40 3 40 3 40 3 B6 Low I4-M1 Days DNC DNC DNC 30.00 90.00 45.00 30.00 90.00 45.00 DNC DNC DNC 30.00 90.00 DNC 20.00 90.00 DNC 7.00 45.00 DNC 7.00 22.50 DNC 7.00 45.00 DNC B4 95 3 60 35 1 60 35 1 60 35 1 60 35 1 B6 Low I4-M2 Days DNC DNC DNC 5.00 30.00 45.00 5.00 30.00 45.00 DNC DNC DNC 7.00 30.00 DNC 7.00 30.00 DNC 5.00 15.00 DNC 10.00 40.00 DNC 7.00 30.00 DNC B5 80 3 80 3 80 3 80 3 80 3 B7 High I2-M1 Days 5.00 5.00 20.00 DNC DNC DNC 1.00 6.00 DNC 5.00 5.00 20.00 1.00 6.00 3 2.00 5.00 3 1.00 2.00 3 2.00 5.00 3 1.00 2.00 3 B6 DNC DNC DNC DNC DNC DNC DNC DNC DNC DNC DNC DNC DNC DNC DNC DNC DNC DNC DNC DNC B7 High I2-M2 Days 5.00 10.00 20.00 DNC DNC DNC 5.00 20.00 DNC 5.00 10.00 20.00 5.00 20.00 2 2.00 20.00 3 3.00 5.00 3 1.00 3.00 3 2.00 4.00 3 B7 20 40 3 60 3 60 3 60 3 60 3 B7 High I2-M3 Days 5.00 10.00 20.00 DNC DNC DNC 2.00 3.00 DNC 5.00 10.00 20.00 2.00 3.00 3 2.00 5.00 3 1.00 3.00 3 1.00 3.00 3 1.00 3.00 3 B8 10 70 2 10 70 2 80 2 80 2 80 2 B8 High I3-M1 Days 0.13 37.50 70.00 20.00 60.00 70.00 20.00 60.00 70.00 0.13 37.50 70.00 20.00 60.00 2 20.00 60.00 2 15.00 60.00 2 20.00 80.00 2 15.00 60.00 2 B8 High I4-M1 Days 5.00 10.00 10.00 30.00 90.00 10.00 30.00 90.00 10.00 5.00 10.00 10.00 30.00 90.00 1 20.00 90.00 1 7.00 45.00 2 7.00 22.50 2 7.00 45.00 2 B8 High I4-M2 Days N/K N/K 10.00 5.00 30.00 10.00 5.00 30.00 10.00 N/K N/K 10.00 7.00 30.00 DNC 7.00 30.00 DNC 5.00 15.00 DNC 10.00 40.00 DNC 7.00 30.00 DNC Business Benefit Thresholds Interim Benefit Scores Benefit Benefit Judge 2 Judge 2 Judge 2 Option 2 Option 2 Option 2 Option 3 Option 3 Option 3 Option 4a Option 4a Option 4a Option 4b Option 4b Option 4b Option 5 Option 5 Option 5 Business Interim Units Min Max Weight Min Max Score Min Max Score Min Max Score Min Max Score Min Max Score B1 I9-M1 % 0.10 0.10 10.00 0.10 0.10 3 0.40 0.40 3 0.80 0.80 3 0.50 0.60 3 0.80 1.00 3 B2 I6-M1 % N/K N/K 20.00 0.00 0.00 DNC 0.80 0.80 DNC 1.00 1.00 DNC 1.00 1.00 DNC 1.00 1.00 DNC Option 2 Option 2 Option 2 Option 2 Option 3 Option 3 Option 3 Option 3 Option 4a Option 4a Option 4a Option 4a Option 4b Option 4b Option 4b Option 4b Option 5 Option 5 Option 5 Option 5 B2 I7-M1 % 0.40 0.40 70.00 0.00 0.00 1 0.80 0.80 3 1.00 1.00 3 0.00 0.00 1 1.00 1.00 3 R A G Score R A G Score R A G Score R A G Score R A G Score B3 I9-M1 % 0.40 0.40 50.00 0.10 0.10 1 0.40 0.40 3 0.80 0.80 3 0.50 0.60 3 0.80 1.00 3 Benefit 1 2 3 1 2 3 1 2 3 1 2 3 1 2 3 B4 I10-M1 Days 1.00 1.00 1.00 1.00 1.00 3 1.00 1.00 3 0.50 0.50 3 0.75 0.75 3 0.63 0.63 3 B1 10 3 10 3 10 3 10 3 10 3 B4 I11-M1 % 0.99 0.99 97.00 0.99 0.99 3 0.95 0.96 1 0.98 0.98 1 0.95 0.96 1 0.97 0.97 1 B2 70 1 70 3 70 3 70 1 70 3 B5 I1-M1 % 0.30 0.30 30.00 0.30 0.30 3 0.30 0.30 3 0.50 0.50 3 0.30 0.30 3 0.50 0.50 3 B3 50 1 50 3 50 3 50 3 50 3 B6 I4-M1 Days 30.00 90.00 45.00 30.00 90.00 3 20.00 90.00 3 7.00 45.00 3 7.00 22.50 3 7.00 45.00 3 B4 98 3 97 1 1 97 1 1 97 1 1 97 1 1 B6 I4-M2 Days 5.00 30.00 45.00 7.00 30.00 3 7.00 30.00 3 5.00 15.00 3 10.00 40.00 2 7.00 30.00 3 B5 30 3 30 3 30 3 30 3 30 3 B7 I2-M1 Days DNC DNC DNC 1.00 6.00 DNC 2.00 5.00 DNC 1.00 2.00 DNC 2.00 5.00 DNC 1.00 2.00 DNC B6 90 3 90 3 90 3 45 45 2 90 3 B7 I2-M2 Days DNC DNC DNC 5.00 20.00 DNC 2.00 20.00 DNC 3.00 5.00 DNC 1.00 3.00 DNC 2.00 4.00 DNC B7 DNC DNC DNC DNC DNC DNC DNC DNC DNC DNC DNC DNC DNC DNC DNC DNC DNC DNC DNC DNC B7 I2-M3 Days DNC DNC DNC 2.00 3.00 DNC 2.00 5.00 DNC 1.00 3.00 DNC 1.00 3.00 DNC 1.00 3.00 DNC B8 90 3 90 3 90 3 80 10 2 90 3 B8 I3-M1 Days 20.00 60.00 70.00 20.00 60.00 3 20.00 60.00 3 15.00 60.00 3 20.00 80.00 2 15.00 60.00 3 B8 I4-M1 Days 30.00 90.00 10.00 30.00 90.00 3 20.00 90.00 3 7.00 45.00 3 7.00 22.50 3 7.00 45.00 3 B8 I4-M2 Days 5.00 30.00 10.00 7.00 30.00 3 7.00 30.00 3 5.00 15.00 3 10.00 40.00 2 7.00 30.00 3 Business Benefit Thresholds Interim Benefit Scores Benefit Benefit Judge 3 Judge 3 Judge 3 Option 2 Option 2 Option 2 Option 3 Option 3 Option 3 Option 4a Option 4a Option 4a Option 4b Option 4b Option 4b Option 5 Option 5 Option 5 Business Interim Units Min Max Weighting Min Max Score Min Max Score Min Max Score Min Max Score Min Max Score B1 I9-M1 % 0.10 0.10 10.00 0.10 0.10 3 0.40 0.40 3 0.80 0.80 3 0.50 0.60 3 0.80 1.00 3 B2 I6-M1 % 0.00 0.00 70.00 0.00 0.00 3 0.80 0.80 3 1.00 1.00 3 1.00 1.00 3 1.00 1.00 3 Option 2 Option 2 Option 2 Option 2 Option 3 Option 3 Option 3 Option 3 Option 4a Option 4a Option 4a Option 4a Option 4b Option 4b Option 4b Option 4b Option 5 Option 5 Option 5 Option 5 B2 I7-M1 % 0.40 0.40 20.00 0.00 0.00 1 0.80 0.80 3 1.00 1.00 3 0.00 0.00 1 1.00 1.00 3 R A G Score R A G Score R A G Score R A G Score R A G Score B3 I9-M1 % 0.10 0.10 10.00 0.10 0.10 3 0.40 0.40 3 0.80 0.80 3 0.50 0.60 3 0.80 1.00 3 Benefit 1 2 3 1 2 3 1 2 3 1 2 3 1 2 3 B4 I10-M1 Days 1.00 1.00 5.00 1.00 1.00 3 1.00 1.00 3 0.50 0.50 3 0.75 0.75 3 0.63 0.63 3 B1 10 3 10 3 10 3 10 3 10 3 B4 I11-M1 % 0.99 0.99 5.00 0.99 0.99 3 0.95 0.96 1 0.98 0.98 1 0.95 0.96 1 0.97 0.97 1 B2 20 70 3 90 3 90 3 20 70 3 90 3 B5 I1-M1 % 0.30 0.30 30.00 0.30 0.30 3 0.30 0.30 3 0.50 0.50 3 0.30 0.30 3 0.50 0.50 3 B3 10 3 10 3 10 3 10 3 10 3 B6 I4-M1 Days 30.00 90.00 45.00 30.00 90.00 3 20.00 90.00 3 7.00 45.00 3 7.00 22.50 3 7.00 45.00 3 B4 10 3 5 5 1 5 5 1 5 5 1 5 5 1 B6 I4-M2 Days 5.00 30.00 45.00 7.00 30.00 3 7.00 30.00 3 5.00 15.00 3 10.00 40.00 2 7.00 30.00 3 B5 30 3 30 3 30 3 30 3 30 3 B7 I2-M1 Days 1.00 6.00 DNC 1.00 6.00 3 2.00 5.00 3 1.00 2.00 3 2.00 5.00 3 1.00 2.00 3 B6 90 3 90 3 90 3 45 45 2 90 3 B7 I2-M2 Days 5.00 20.00 DNC 5.00 20.00 3 2.00 20.00 3 3.00 5.00 3 1.00 3.00 3 2.00 4.00 3 B7 3 3 3 3 3 B7 I2-M3 Days 2.00 3.00 DNC 2.00 3.00 3 2.00 5.00 2 1.00 3.00 3 1.00 3.00 3 1.00 3.00 3 B8 90 3 90 3 90 3 80 10 2 90 3 B8 I3-M1 Days 20.00 60.00 70.00 20.00 60.00 3 20.00 60.00 3 15.00 60.00 3 20.00 80.00 2 15.00 60.00 3 B8 I4-M1 Days 30.00 90.00 10.00 30.00 90.00 3 20.00 90.00 3 7.00 45.00 3 7.00 22.50 3 7.00 45.00 3 B8 I4-M2 Days 5.00 30.00 10.00 7.00 30.00 3 7.00 30.00 3 5.00 15.00 3 10.00 40.00 2 7.00 30.00 3 Rule 3 Rule 4 Rule 5 The business benefit scores for each option from every business SME (workshop 2 judge) are aggregated into one overall business benefit score for each option by taken the lowest performance Option 2 Option 3 Option 4a Option 4b Option 5 Benefit Score Score Score Score Score Option 2 Option 2 Option 2 Option 2 Option 3 Option 3 Option 3 Option 3 Option 4a Option 4a Option 4a Option 4a Option 4b Option 4b Option 4b Option 4b Option 5 Option 5 Option 5 Option 5 B1 1 1 3 1 3 Weighting Weighting Weighting Weighting Weighting Weighting Weighting Weighting Weighting Weighting High High Low Low B2 1 3 3 1 3 Benefit Priority High RAG Low RAG High RAG Low RAG High RAG Low RAG High RAG Low RAG High RAG Low RAG Option R A R A B3 1 3 3 3 3 B1 High 10 R R 10 R R 10 G G 10 R R 10 G G Option 2 133.33 90.00 0.00 0.00 B4 3 1 1 1 1 B2 High 90 R R 90 G G 90 G G 90 R R 90 G G Option 3 77.67 90.00 0.00 0.00 B5 3 3 3 3 3 B3 High 33 R R 33 G G 33 G G 33 G G 33 G G Option 4a 67.67 90.00 0.00 0.00 B6 3 3 3 2 3 B4 High 68 G G 68 R R 68 R R 68 R R 68 R R Option 4b 167.67 90.00 0.00 60.00 B7 3 3 3 3 3 B5 Low G 47 G G 47 G G 47 G G 47 G G 47 G Option 5 67.67 90.00 0.00 0.00 B8 2 2 2 2 2 B6 Low G 60 G G 60 G G 60 G A 60 A G 60 G B7 High 20 G G 20 G G 20 G G 20 G G 20 G G B8 High 90 A A 90 A A 90 A A 90 A A 90 A A Score Index Score RAG 1 R 2 A 3 G The aggregated RAG results for each business benefit are displayed in a pie, incorporating the average impact weighting across the business SMEs (workshop 2 judges). In order to incorporate the instances where weighting scores are missing (DNC or N/K) but performance and threshold scores exist we assign a number to "DNC" that enables us to determine the majority score for the business benefit. To ensure this doesn’t interfere with given weightings when only some of the weightings are missing, the number must be very small. We have therefore taken the number to be the lowest weighting from that judge divided by 1000. Takes the minimum and maximum value for each interim benefit across all judges., creating a maximum performance range. B1 B2 B3 B4 B7 B8 B1 B2 B3 B4 B7 B8 B1 B2 B3 B4 B7 B8 B1 B2 B3 B4 B7 B8 B1 B2 B3 B4 B7 B8 B5 B6

Low Priority

B5 B6

Low Priority

B5 B6

Low Priority

B5 B6

Low Priority

B5 B6

Low Priority

RULE 0 RULE 1 RULE 2 RULE 3 RULE 4 RULE 5 WORKSHOP 1 DATA WORKSHOP 2 DATA

NON-FINANCIAL BENEFITS ANALYSIS

slide-4
SLIDE 4

COST MODEL OVERVIEW

Charts Option 2 Do Min Option 3 BOB Option 5 hybrid Option 4d Option 4c Option 4b Option 4a

Outputs

Overview Controls Inputs Intro

Overview, Inputs & Assumptions Calculations

Market Prices: Gcloud / GPS / PSN Project Documentation: Transition timeline / app study / architecture / scaling document / GFA study Worksheet External Data Source Hard link Information Link

Legend

SMEs Funding ARM Transition Managed Network Historical Costs BOB-LEARN Risk Managed Desktop Apps & PAAS Desktop Support Server To-be Scaling SIAM Phased - Opt 5 Frozen Charts Frozen Option 2 Do Min Frozen Option 3 Frozen Option 5 Frozen Option 4d Frozen Option 4c Frozen Option 4b Frozen Option 4a CO Output Frozen CO Output Phased - Opt 4 Big Bang Offset SMART Tables Frozen Smart Output

SENSITIVITY ANALYSIS

Sensitivity Scenario O2 O3 O4a O4b O4c O4d O5 Baseline

Baseline ranking order 4 5 7 2 6 1 3

S1

N/A N/A N/A N/A N/A N/A N/A N/A

S2

N/A N/A N/A N/A N/A N/A N/A N/A

S3

The integration overhead for ACIIP is 50% higher than the maximum expected value. 4 6 7 2 5 1 3

S4

The integration overhead for NTIIP is 50% higher than the maximum expected value. 4 6 7 2 5 1 3

S5 (1)

The desktop managed service charge falls to half the minimum value seen from any supplier on the Desktop 21 framework. 7 6 4 2 3 1 5

S5 (2)

The desktop managed service charge rises by more than 50% of the maximum value seen from any supplier on the Desktop 21 framework. 3 5 7 4 6 2 1

S6

The server to EUD ratio rises by more than seven times the most likely value (consistent only with small site statistical fluctuations). 3 5 7 4 6 2 1

S7

Absolutely no rationalisation of support staff is possible following the move to thin client devices. 1 4 6 7 5 3 2

S8

All IT support workers are paid the industry maximum salary for the role. 3 5 7 2 6 1 4

S9

No thin client devices are used in the Option 5. 3 5 7 2 6 1 4

DATA COLLECTION MODEL CONSTRUCTION

A large number of data sources were consulted, including:

  • Existing framework catalogue prices
  • Historical running costs for legacy systems
  • Scaling information provided by FLCs
  • Open source information (e.g. technical white papers)
  • SME workshops

ISS CAAS have performed an independent verification of all data sources. Statistical techniques were used to identify the most sensitive data inputs. These were varied to determine how much they influence the NPV ranking. The cost model was built in accordance with JSP 507 on a Whole Life Cost basis, covering a ten year period. The Net present Value (NPV) of each option was calculated using the recommended Treasury Discount Rate of 3.5% and used to compare options. The model was built from the bottom up, combining the best available scaling data and costing information with three-point-estimates to handle uncertainty, which were combined probabilistically using @Risk. Each of the four communities was costed separately across the six categories:

  • MOD Costs
  • Setup / Integration / Transition Costs
  • Legacy Costs
  • Equipment Costs
  • Operation Costs
  • Risk

ISS CAAS independently validated the cost model construction. The plots above show how the total NPV changes as the most sensitive inputs were varied. The vertical bars show the minimum, most likely and maximum values of the 3 point estimates. Often the parameters needed to extend far beyond the maximum values to change the NPV ranking. A count of the NPV ranking in these extreme scenarios is given on the left, which shows that the same options score highly even in at these extremes.

NON-FINANCIAL BENEFITS ANALYSIS INVESTMENT APPRAISAL

slide-5
SLIDE 5

ATIIP RESULTS NTIIP RESULTS

Operational costs are key financial drivers across all options, which are reduced considerably by a thin client solution. Thin client also reduces tech refresh spend. ‘Big bang’ options carry greater risk than ‘phased options’ Options with lowest NPV are 4b, 4d, 5 and 2 but it is difficult to distinguish between them in pure NPV terms. More data is needed to reduce the uncertainty. Operational costs are key financial drivers across all options, which are reduced considerably by a thin client solution. Option 2 has higher operational costs due to thick client, but lower up front investment. Options with lowest NPV are 4b and 4d, but Options 2 and 5 cannot definitively be ruled out and Option 5 offers greater potential for savings than Option 2. More data is needed to reduce the uncertainty.

ACIIP RESULTS DTTCP RESULTS

Because ACIIP has a higher proportion of sites to access devices compared with

  • ther FLCs, there is a relative increase in equipment and service integration costs.

Reduced operational costs are achievable using thin client. Options with lowest NPV are 4b, 4d, followed by 5 and 2. There is some degree of

  • verlap between options and more data is needed to reduce the uncertainty. It is

expected that new data will reduce the cost of Option 2 which will increase the VFM of this option (data not included in these figures). Key areas of spend are similar to other options, except there is no contribution from a legacy system in early years. Also, because DTTCP is confined to one site it has relatively lower integration and network equipment costs. It is very difficult to say which option definitively has the lowest NPV, although there is a general trend towards Options 4b, 4d and 5.

OVERALL NPV OPTION RANKING

In general most options show some degree of overlap between the 10% and 90% confidence intervals. However the following general trend is seen:

  • Option 4b and 4d are typically the best options from an NPV perspective
  • Option 5 and Option 2 are typically the next best options and are generally hard to distinguish when

the confidence intervals are compared. However Option 5 offers greater potential savings depending on the degree to which thin client is implemented.

  • Options 3, 4a and 4b typically have the highest NPV.
  • Significant potential savings from thin client architecture.
  • Modest savings from commodity service providers (partially offset by need for integrator)
  • Additional Spend in early years for new architectures.

GENERAL INVESTMENT APPRAISAL CONCLUSIONS

NON-FINANCIAL BENEFITS ANALYSIS INVESTMENT APPRAISAL

slide-6
SLIDE 6

EXAMPLE ATIIP RESULTS EXAMPLE NTIIP RESULTS EXAMPLE ACIIP RESULTS EXAMPLE DTTCP RESULTS EXAMPLE RECOMMENDATIONS

For DTTCP, it is recommended that Option 5 is taken forward. This will allow the approach to be validated, and the uncertainties identified in the IA to be reduced for the other FLCs. For ATIIP and NTIIP, it is recommended that the legacy arrangements (Option 2) are extended in the short term to allow further information to be gathered by DTTCP to determine whether a variant of Option 4 or 5 actually offers better VFM. For ACIIP, Option 5 appears to offer the best VFM based on the information available. However as this option would require a short term extension of legacy arrangements (Option 2), there is an

  • pportunity for the investment decision to be revisited based on updated data from the DTTCP

trial. It was not possible to distinguish between options from a non-financial benefits perspective. There is a reasonable overlap between the 10% to 90% NPVs for most options, particularly 2, 4b, 4d and 5. When OCFs are taken into account there’s a general preference towards 4b, 4d and 5, since these are better aligned with Government Policy. Phasing the delivery would allow the approach to be validated by DTTCP. It was not possible to distinguish between options from a non-financial benefits

  • perspective. Note that a RED benefit score only indicates that the option does not

deliver any additional benefit over the KURs. There is a reasonable degree of overlap between option NPVs, particularly 2, 4b, 4d and 5 – but 4b and 4d offer the greatest potential for savings. When OCFs are taken into account, 4d and 5 would be preferred overall due to the alignment with Government policy and by providing an opportunity to allow the approach to be first validated by DTTCP. There was a clear demarcation between options arising from the benefits analysis, in which Option 5 was ranked 1st, and Options 4c and 4a 2nd. From a financial perspective, there is a clear separation between the highest and second highest ranked benefits option, although Option 2 is similar in terms of NPV. Note that the NPV of option 2 may fall further when recent new information is taken into account (not shown in this figure). The analysis shows that Option 5 is the most cost effective option, although the analysis should be updated when new data becomes available. From a benefits perspective, Options 5, 4c and 4a are ranked equal 1st for DTTCP, of which Option 5 has the lowest NPV, making this the preferred option overall, although 4c cannot be entirely ruled out. It is recommended that Option 5 is pursued for DTTCP, and that data gathered from the trial is used to update the analysis for the other FLCs. This will ensure that their recommendations are made based on the best available data, and will allow any lessons learned from DTTCP to be incorporated into their approach.

NON-FINANCIAL BENEFITS ANALYSIS EXAMPLE COEIA RESULTS