ISRP Retrospective Review Lower Snake River Compensation Plan Goal - - PowerPoint PPT Presentation

isrp retrospective review
SMART_READER_LITE
LIVE PREVIEW

ISRP Retrospective Review Lower Snake River Compensation Plan Goal - - PowerPoint PPT Presentation

ISRP Retrospective Review Lower Snake River Compensation Plan Goal Replace Lost Adult Salmon & Steelhead Caused by the Construction and Operation of the Four Lower Snake River Dams S.L. Marshall (2010) Snake River & Lower Granite


slide-1
SLIDE 1

ISRP Retrospective Review Lower Snake River Compensation Plan

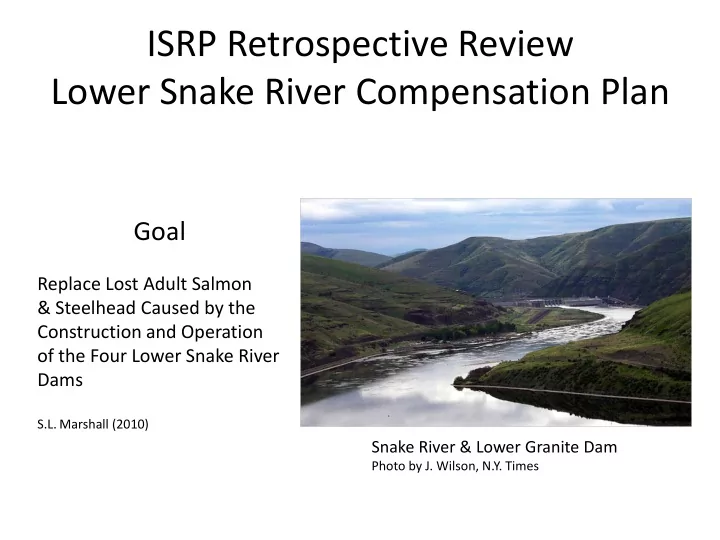
Snake River & Lower Granite Dam

Photo by J. Wilson, N.Y. Times

Goal

Replace Lost Adult Salmon & Steelhead Caused by the Construction and Operation

  • f the Four Lower Snake River

Dams

S.L. Marshall (2010)

slide-2
SLIDE 2

LSRCP Hatcheries

  • Oregon
  • Lookingglass
  • Wallowa
  • Irrigon
  • Umatilla
  • Washington
  • Lyons Ferry
  • Tucannon
  • Idaho
  • Clearwater (CR, Red Powell)
  • Magic Valley
  • Dworshak NFH
  • Hagerman NFH
  • McCall
  • Sawtooth
  • Idaho Power Company
  • Oxbow
  • Nez Perce Tribe
  • Nez Perce Tribal Hatchery

From BPA Integrated Program Review Fish & Wildlife Program (2014)

slide-3
SLIDE 3

Estimating Losses

(Using Steelhead As An Example)

Photo from M. Gallinat (2010)

Steps:

1) Estimate Escapement Prior to Dam Construction (Steelhead = 114,800 Adults) 2) Estimate Smolt Mortality at Each Dam (Steelhead = 15% Loss Per Dam, 48% Total Loss) 3) Estimate Number of Adults Lost Due to Dams (114,800 Adults x 48% = 55,100 55,100 Became the LSRCP Return Goal for Steelhead)

slide-4
SLIDE 4

Estimating Losses

(Using Steelhead As An Example)

Photo from L. Clarke et al. (2012)

Steps:

4) Estimate Smolt to Adult Return to Lower Granite Dam = 0.5% (No. of smolts needed to produce 55,100 55,100/.005 = 11,020,00) 5) Estimate Egg-to-Smolt Survival (Assumed 65%, Therefore No. of Eggs Needed = 11.02 M /.65 = 16.95 M)

slide-5
SLIDE 5
  • Spring Chinook
  • 58,700 Adults To Project Area
  • 234,800 Adults To Fisheries
  • Steelhead
  • 55,100 Adults To Project Area
  • 110,200 Adults To Fisheries
  • 130,000 Angler Days
  • Fall Chinook
  • 18,300 Adults To Project Area
  • 73,200 Adults To Fisheries

Mitigation Goals

Illustrations: Idaho Fish & Game & Bing

slide-6
SLIDE 6

Photo USFWS

Unforeseen Factors Affected LSRCP

  • Lower Smolt-to-Adult Survivals
  • ESA Listings of:
  • Fall & Spring Chinook (1992)
  • Steelhead (1997)
  • Downstream Harvests Curtailed

& More Fish Back to Project Area

  • US v. Oregon
  • Hatchery Production Set
  • New Stocks & Release Areas
  • Harvest Mitigation Project Changed

to Harvest & Conservation Project

slide-7
SLIDE 7

ISRP Retrospective Review

LSRCP Steelhead, Fall & Spring Chinook Programs

Purpose Of Review

1) To determine if the Three Programs are: Based on Sound Science Benefit Fish & Wildlife Have Clearly Defined Objectives Contain M & E Programs

Photo Of Lyons Ferry Hatchery M. Key (2013)

slide-8
SLIDE 8

ISRP Retrospective Review

LSRCP Steelhead, Fall & Spring Chinook Programs

Purpose Of Review

2) To Evaluate:

In-Hatchery Performance Post-Release Performance Ecological Interactions Program Modifications

3) Consistent With Council’s FWP

Artificial Production Standards & Strategies

Photo Of Irrigon Hatchery from Carmichael et al. (2012)

slide-9
SLIDE 9

In-Hatchery Performance

Metrics:

  • Broodstock Collection & Survival
  • Egg-to-Smolt Survival
  • Number of Smolts

Photo from E. Loudenslager (2011)

slide-10
SLIDE 10

Broodstock Collection & Survival

Spring Chinook

Survival Goal > 80% Yrs Achieved 90%

Steelhead

No Universal Goal For Survival

Fall Chinook

Survival Goal 90% Yrs Achieved 86%

Photo From J. Bumgarner (2012)

slide-11
SLIDE 11

Egg-to-Smolt Survival Goals

Spring Chinook

Survival Goal > 70% Yrs Achieved 92%

Steelhead

Survival Goal 65%-70% Yrs Achieved 76%

Fall Chinook

Survival Goal 70% - 80% Yrs Achieved 79%

Photo from R. Carmichael et al. (2012) Photo From J. Bumgarner (2012)

slide-12
SLIDE 12

Smolt Release Goal:

Spring Chinook

From Mark Shuck LSRCP Roll-up (2010)

slide-13
SLIDE 13

2 4 6 8 Smolts Released (Millions)

Migration Year

WA OR ID

1989- 6.25M 2010- 5.35M

Smolt Release Goal:

Steelhead

From B. Leth Steelhead Roll-up (2012) Photo B. Leth Steelhead Roll-up (2012)

slide-14
SLIDE 14

1,000,000 2,000,000 3,000,000 4,000,000 5,000,000 6,000,000 7,000,000 1985 1988 1991 1994 1997 2000 2003 2006 2009 2012 Release Year

Yearling Subyearling

Smolt Release Goal Fall Chinook

From J. Hesse PPT to NPPC Council 2014

Sub-yr Yr

slide-15
SLIDE 15

Factors Affecting Release Goals

Spring Chinook

Broodstock Scarcity Reductions in Rearing Densities Water Shortages at Some Hatcheries

Steelhead

Greater Smolt Size Goal Set Decreases in Water Availability Shift in Production to Spring Chinook

Fall Chinook

Broodstock Scarcity

Lyons Ferry Hatchery

Photo by D. Gloyn (2013)

slide-16
SLIDE 16
  • Survival to Lower Granite Dam
  • Smolt-to-adult survival (SAS)
  • Smolt-to-adult Return (SAR)
  • Recruits per Spawner (R/S)
  • Harvest (below and within

project area)

Photo from B. Leth steelhead roll-up (2012)

Post Release Metrics

slide-17
SLIDE 17

0% 10% 20% 30% 40% 50% 60% 70% 80% 90% 100% Survival

Migration Year

Smolt Survival to Lower Granite Dam:

Steelhead

Average Imnaha Grande Ronde OR Salmon River Clearwater Grande Ronde WA

  • B. Leth steelhead roll-up (2012)
slide-18
SLIDE 18

Smolt Survival to Lower Granite Dam:

Spring Chinook

From Mark Shuck LSRCP Roll-up (2010)

Potential Factors Affecting Survival River Flow Water Temperature Turbidity Travel Distance Date of Release Type of Release Direct-Release Acclimation Pond Fish Size Yearling Sub-Yearling Smoltification Stage Fish Health Time Of Release Diurnal Nocturnal

slide-19
SLIDE 19

0.0% 0.5% 1.0% 1.5% 2.0% 2.5% 3.0% 3.5% 4.0% 4.5% 5.0%

Steelhead SAS By Brood Year

Smolt-to-Adult Survival & Return Rates

Steelhead & Spring Chinook

From B. Leth Steelhead Roll-up (2012)

Spring Chinook

SAS Goal 3.25% - 4.35% Years Achieved = 0% SAR Goal 0.1% - 0.87% Years Achieved = 41%

Steelhead

SAS Goal 1.5% - 2.61% Years Achieved = 38% SAR Goal 0.5% - 0.87% Years Achieved = 83% Survival

slide-20
SLIDE 20

Recruits Per Spawner

Hatchery Steelhead

10 20 30 40 50 60 Brood Year 1981-2006 Average= 18.6

Recruits Per Spawner

From B. Leth steelhead roll-up (2012)

R/S = 1

slide-21
SLIDE 21

Percentage Of Goal

Adult Abundance

Spring Chinook Salmon

From Mark Shuck roll-up (2010)

ESA Listing

slide-22
SLIDE 22

20 40 60 80 100 120 140 160

Number of Adults (Thousands)

Above Project Goal 55,100

ESA Listing

Adult Steelhead Abundance

Above Project

From B. Leth Steelhead Roll-up (2012)

slide-23
SLIDE 23

Hatchery Fall Chinook Returns Natural Origin Fall Chinook Returns

Adult Fall Chinook Abundance

Snake River

From J. Hesse PPT to NPPC Council 2014 30,000 50,000 10,000 20,000 40,000 From J. Hesse Fall Chinook Roll-up (2013)

Hatchery Escapement Goal Minimum Viability Goal Escapement Goal

slide-24
SLIDE 24

Spring Chinook Harvest

Fisheries In Project Area

No Fisheries From 1975 – 1995 In 2010: 9 % Of Historical Harvest 31% Of Historical Area 16% Of Historical Fishing Days Fishing Opportunities are Growing With Increases in Abundance

Photo of Spring Chinook Fishing In The Lower Snake River

Photo from Bing

  • M. Shuck spring Chinook Roll-up (2010)
slide-25
SLIDE 25

Steelhead Harvest

In Project Area

Pre Project Harvest & Effort

  • Average of 26,000 Caught Per Year
  • Average Angler Effort 130,000 days

Post Project 1998 – Present

  • Average of 62,000 Caught Per Year
  • Average Angler Effort 475,000 days

Photo From L. Clarke et al. (2012)

  • B. Leth Steelhead Roll-up (2012)
slide-26
SLIDE 26

Program Returns + Harvest % Col R & Ocean % Snake River Total % IPC 24,791 20 0.1 20 LSRCP 104,684 44 0.3 44 FCAP 45,284 44 0.3 45 NPTH 8,334 26 <0.1 26

Fall Chinook Harvest

Snake River

Photo: sarasotasalilingsquadron.com

Exploitation Rates

Brood Years 1994-2007 (Ad Clipped CWT Fish)

From Milks et al. (2013)

slide-27
SLIDE 27

Fish &Wildlife Program Artificial Production Standards and Strategies

 Operate in an Experimental & Adaptive Manner  Minimize Adverse Effects on Other Stocks Through Straying & Harvest  Preserve Natural Populations Where Habitat is Intact  Restore, Preserve, and Rebuild Natural Populations

slide-28
SLIDE 28

10 20

%

% STRAY RATE

Figure From Clarke et al. 2012

Average Annual Deschutes River

Straying By Snake River Hatchery Steelhead

Photo Of Lower Deschutes River From Findfish.com

slide-29
SLIDE 29

– Incubation, Rearing, and Release Strategies – Release Location – Stock Origin – Seaward Migration Pathways (In-river vs. Transported) – Columbia River and Deschutes Water Temperatures

John Day River Photo From pinterest.com

Potential Factors Affecting

Straying Frequencies

From R. Carmichael (2012)

slide-30
SLIDE 30

Acclimated vs. Direct Release Studies

Steelhead

Wallowa Hatchery Studies

  • 1. Acclimated vs. Direct Releases
  • 2. Volitional vs. Forced Release

From Clarke et al. (2012)

slide-31
SLIDE 31

Acclimated vs. Direct Release

  • 1. Smolt-to-adult Survival

(33.3% higher survival for acclimated releases p = 0.013)

  • 4. Stray frequency

(70% higher stray rates for direct releases p = 0.001)

Results of Acclimated v. Direct Releases

Steelhead

From Clarke et al. 2012 Photo from J. Bumgarner (2012)

slide-32
SLIDE 32

Results of Volitional vs. Forced Releases

  • 1. Smolt-to-adult Survival

(no difference detected p = 0.658)

  • 2. Straying frequency

(no difference detected p = 0.852)

Results of Volitional vs. Forced Releases

Steelhead

From Clarke et al. (2012) Big Canyon Acclimation Pond

Photo from Clarke et al. (2012)

slide-33
SLIDE 33

Results of Volitional vs. Forced Releases

  • 3. Volitional Releases Allow the Removal
  • f “Residual” Males at End of

the Release Period When 70% of the Fish Remaining in a Pond are Males—They are Trucked and Released Into Local Ponds for Fisheries

Results of Volitional vs. Forced Releases

Steelhead

From Clarke et al. (2012) Photo by Mike Croxford

slide-34
SLIDE 34

Acclimation Ponds Studies

Spring Chinook

Effects of Duration Of Acclimation Period

  • 1. 4 Months vs. 2 Months
  • 2. Fish Acclimated for 4 Months Had

Higher Smolt-to-Adult Survival Rates (p < 0.005) Umatilla River

Photo nwwaterfrontrealestate.com

slide-35
SLIDE 35

South Fork Salmon River

Photo by panoramio.com

Protecting Natural Production Areas

Steelhead & Spring Chinook

Natural Spawning & Rearing Areas in Idaho, Oregon, & Washington are Being Protected & Monitored

slide-36
SLIDE 36

Wild Stock Protection

Grande Ronde Spring Chinook

From R. Carmichael (2010)

Incidence Of Strays

1. 1986-1994 > 50% 2. Endemic Broodstock & Acclimation Ponds 2000 3. Present Occurrence of Strays 2002 – Present < 5%

slide-37
SLIDE 37

Photo From T. Hoffnagle et al. (2010)

Approach Of Captive Brood Program

1) Collect 500 Parr in the Grande Ronde River, Catherine Creek, & Lostine River

Conservation via Captive Brood Program

Grande Ronde Spring Chinook

slide-38
SLIDE 38

Juvenile Chinook Salmon, Tucannon River From M. Gallinat (2010)

Approach Of Captive Brood Program

2) Rear Wild Parr to Maturation

Conservation via Captive Brood Program

Spring Chinook

slide-39
SLIDE 39

Conservation via Captive Brood Program

Approach Of Captive Brood Program

3) Artificially Spawn Reared Adults 4) Rear Subsequent Progeny to Smolt Stage and Release 5) Allow Resulting F1 Adults to Spawn in Nature

Tucannon River Captive-reared Adult Spring Chinook—Photo from M. Gallinat (2010)

slide-40
SLIDE 40

Type

  • No. Of

Parr

  • No. Adult

Females Produced

  • No. Of F1

Adults Captive Brood 500 133 370 Conv. Hatch 500 1.1 18 Natural 500 0.6 2

Data From T. Hoffnagle et al. (2010)

Comparison of F1 Adult Production

Photo: thewildlifenews. com

slide-41
SLIDE 41

Results Of Captive Brood Program

Grande Ronde Spring Chinook

1. Contributed Smolts to Hatchery Releases 2. Increased Adult Abundance in Targeted Streams 3. Reduction in Smolts Per Spawner as Spawner Densities Increased

Lostine River Photo Flickr.com From T. Hoffnagle et al. (2010)

slide-42
SLIDE 42

Regional & LSRCP Challenges

  • 1. Identifying Factors Responsible for

Density-Dependency in Natural Spawning and Rearing Habitats

  • 2. Assessing & Reducing Stray Rates
  • 3. Regulating Numbers of Hatchery Fish on

Spawning Grounds

  • 4. Evaluating the Utility of Supplementation
  • 5. Identification of Project Fish in Fisheries &
  • n Spawning Grounds

RM&E

Spring Chinook Smolts

Photo from kera-kw.com

slide-43
SLIDE 43

LSRCP Challenges

  • 6. Integrating & Coordinating LSRCP Programs

With on-going Regional Habitat Restoration, Harvest Management, US v. Oregon Agreements & ESA Recovery Efforts

  • 7. Using Artificial Production to Augment

Harvest While Simultaneously Implementing Recovery Actions for ESA-Listed Steelhead & Chinook

  • 8. To Achieve Mitigation Goals Will Require Action

Beyond the Responsibilities of the LSRCP

Regional & Basin-Wide Management

Adult Spring Chinook

Photo from businessweek.com

slide-44
SLIDE 44
slide-45
SLIDE 45

Egg-to-Smolt Survival: Steelhead

Across All Projects

0.2 0.4 0.6 0.8 1

Photo from J. Bumgarner (2012)

Egg-to-Smolt Survival Brood Year

From B. Leth steelhead roll-up (2012)

slide-46
SLIDE 46

Smolt Release Goals

Spring Chinook

Goal = 6 – 7.5 Million Yrs Achieved = 42%

Steelhead

Goal = 5.3 – 6.8 Million Yrs Achieved = 57%

Fall Chinook

0+ Goal = 4.6 Million Yrs Achieved = 69% 1+ Goal = 0.9 Million Yrs Achieved = 95% Spring Chinook smolts

Photo workareaonline.com

slide-47
SLIDE 47

100 80 60 Big Canyon Pittsburg Land Capt John Rap 40 20 2006 2007 2008 2009 2010 2011 2012

Survival %

Yearling Fall Chinook Survival To Lower Granite Dam

Acclimation Pond Releases

From M. Key (2013)

slide-48
SLIDE 48

Smolt-to-Adult Returns (SAR)

Spring Chinook

From Mark Shuck roll-up (2010)

% Smolt-to-Adult Return

slide-49
SLIDE 49

Lyons Ferry Dworshak B Sawtooth Pahsimeroi Hells Canyon Imnaha Wallowa

Deschutes River basin

From Clarke et al. (2012)

Snake River Hatchery Steelhead Stocks

slide-50
SLIDE 50

Photo From M.L. Keefer and C. Caudill Tech. Rept. 2012-6 Draft

Effects of Barging On Straying

Steelhead

1 2 3 4 5 6 7 8 9 10 2007-08 H 2007-08 wild 2008-09 H 2008-09 wild Transport In-River

Stray rates into the Deschutes Stray rates were: Higher for Transported Fish Within Transported Fish: Hatchery > Natural

  • R. Carmichael & T. Hoffnagle (2012)
slide-51
SLIDE 51

Wild Stock Protection

Salmon River Steelhead

! ( ! ( ! ( ! ( ! ( ! ( ! ( ! ( ! ( ! ( ! ( ! ( ! ( ! ( ! (

²

50 25 Miles

Little Salmo n R. SF Salmon R. Upper Salmon R. EF Salmon R. Pahsimer

  • i R.

Lemhi R. Lower Middle Fork Salmon R. Panther Cr. NF Salmo n R. Chamberl ain Cr. Secesh River

Hatchery Release Site

! ( ! ( ! ( ! ( ! ( ! ( ! ( ! ( ! ( ! ( ! ( ! ( ! ( ! ( ! ( ! ( ! ( ! ( ! ( ! ( ! ( ! ( ! ( ! ( ! ( ! ( ! ( ! ( ! ( ! ( ! ( ! ( ! ( ! ( ! ( ! ( ! ( ! ( ! ( ! ( ! ( ! ( ! ( ! ( ! ( ! ( ! ( ! ( ! ( ! ( ! ( ! ( ! ( ! ( ! ( ! ( ! ( ! ( ! ( ! ( ! ( ! ( ! ( ! ( ! ( ! ( ! ( ! ( ! ( ! (
  • Hatchery Releases

Little Salmon R. and Upper Salmon R

  • No Releases

South Fork Middle Fork North Fork Mainstem Salmon downstream of the North Fork

From Brian Leth (2012)

Upper Salmon

Area FST Hatch Pop

Middle Salmon South Fork Low Salmon

slide-52
SLIDE 52

! ( ! ( ! ( ! ( ! ( ! ( ! ( ! ( ! ( ! ( ! ( ! ( ! ( ! ( ! ( ! ( ! ( ! ( ! ( ! ( ! ( ! ( ! ( ! ( ! ( ! ( ! ( ! ( ! ( ! ( ! ( ! ( ! ( ! ( ! ( ! ( ! ( ! ( ! ( ! ( ! ( ! ( ! ( ! ( ! ( ! ( ! ( ! ( ! ( ! ( ! ( ! ( ! ( ! ( ! ( ! ( ! ( ! ( ! ( ! ( ! ( ! ( ! ( ! ( ! ( ! ( ! ( ! ( ! ( ! ( Clearwater River Grand Ronde Lower Snake Hells Canyon Salmon River

MT ID NV OR WY WA

Wild Stock Protection

Clearwater Steelhead

Dworshak Natural Population Tributary

  • Avg. Pairwise

FST

Colt Cr

Lochsa R. No Releases

0.023 Storm Cr 0.025 Crooked Fork 0.018 Lake Cr 0.025 Fish Cr 0.018 Canyon Cr 0.013 Selway R

Selway R. No Releases

0.024 Little Clearwater R 0.023 Whitecap Cr 0.024 Bear Cr 0.025 NF Moose Cr 0.018 Three Links Cr 0.026 Gedney Cr 0.016 O'Hara Cr 0.011 Clear Cr

SF Clearwater Releases

0.011 Crooked R 0.004 Tenmile Cr 0.021 John's Cr 0.010

Stiefel and Leth (2012)

slide-53
SLIDE 53

Hatcheries, Supplementation & Conservation

slide-54
SLIDE 54

Wild Fish To Hatchery 1st Generation Hatchery Adults To The Wild = A NORs From 1st Generation Hatchery Parents = B Wild Fish To Wild Wild Fish To Wild Wild Fish To Wild

Is A > B ? Operational Definition Of Supplementation

slide-55
SLIDE 55

Key Assumptions Of Supplementation:

1) Hatchery-Origin Fish Are Reproductively Competent When Allowed To Spawn Under Natural Conditions

Photo: Oceanmdx www.skyscrapercity.com

slide-56
SLIDE 56

Key Assumptions Of Supplementation

2) Progeny Produced By Hatchery Origin Adults Can Survive In Nature

Spring Chinook Juvenile

Photo grantpud.org

slide-57
SLIDE 57

Key Assumptions of Supplementation

Grande Ronde River

Photo commons.wikimedia..org

3) The Receiving Environments Are Productive & Complex Enough To Accommodate Additional Juveniles

slide-58
SLIDE 58

Catherine Creek Grande Ronde River Lostine River

300000 250000 200000 150000 100000 50000 1998 2000 2002 2004 2006 2008

Brood year

1998 2000 2002 2004 2006 2008

Number of smolts

Captive Broodstock Conventional Broodstock LSRCP target CBS target

Catherine Creek Acclimation Pond

Photo from R. Carmichael (2010) Data From T. Hoffnagle et al. (2010)

Changes In Smolt Origin

slide-59
SLIDE 59

100 200 300 400 500 600 700 800 1998 1999 2000 2001 2002 2003 2004 CB Adults Goal

Captive Brood Adult Returns

Catherine Creek

Photo pinterest.com Data from T. Hoffnagle et al. (2010)

Number of Adults Brood Year

slide-60
SLIDE 60

Results Of Captive Brood Program

Grande Ronde Spring Chinook

Parr Collections: Generally Met Growth: Slower than Expected Survival: Wild Parr-to-Smolt > 95% Wild Smolt-to-Adult ~ 55% Mortality: BKD Largest Cause Maturity: Male matured earlier than expected – most at age 3 Females matured later, more 5’s than expected Fecundity: 60% Lower than expected

Lostine River Photo Flickr.com From T. Hoffnagle et al. (2010)

slide-61
SLIDE 61

Recognized Challenges In The Captive Broodstock Program

  • F0 Smolt-to-Adult Growth
  • F0 Fecundity
  • Egg Culling & Disease During Rearing
  • Hatchery Performance of F1’s
  • Potential Gene Amplification

Captive Broodstock Challenges

Photo from Venditti et al. (2005)

From Hoffnagle et al. (2010)