
SLIDE 1
1
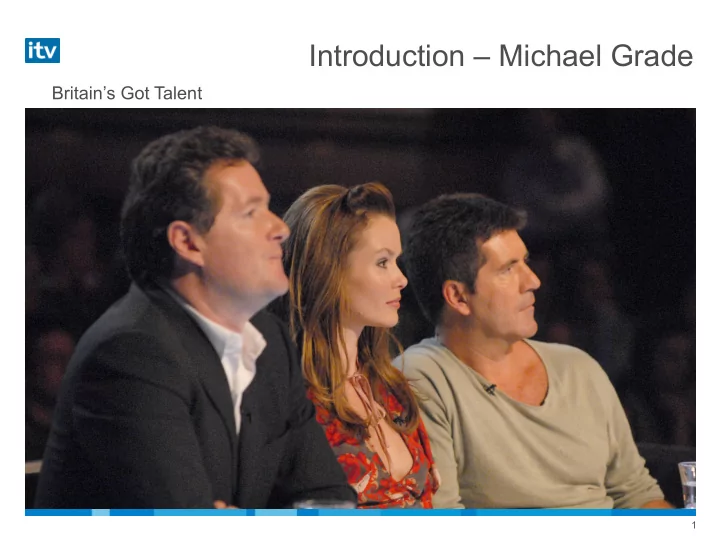
Introduction – Michael Grade
Britain’s Got Talent
Introduction Michael Grade Britains Got Talent 1 Interim Results - - PowerPoint PPT Presentation
Introduction Michael Grade Britains Got Talent 1 Interim Results Introduction Core business stabilising UK TV advertising market Flat in H1 Up 6% in Q3 ITV1 YTD impact volume +0.6% YTD Adult SOCI down 4.8%
1
Britain’s Got Talent
2
Source: BARB/Infosys, Adult SOCI, YTD = 01st Jan – 29th July
3
4
Trinny and Susannah
5
Agenda
6
EBITDA#
Operating EBITA#
100 200 300 400 500 2005 2006 2007
ITV plc revenues outside ITV1 NAR 41% of revenue in 2007 £m
# Before exceptional items * Before exceptional items, amortisation and tax adjustments
7
# Before exceptional items
6 months to 30th June - £m 2007 2006 Change Published
Published %
Revenue 1,004 1,077
Operating EBITA 151# 202#
Amortisation Normal (28) (28) CSA write down (28)
34 10 Associates, JVs and investment income 3 6 Profit before interest and tax 132 190
Interest (27) (17) Profit before tax 105 173
8
* Before exceptional items, amortisation and tax adjustments
6 months to 30th June - £m 2007 2006 Change Published
Published %
Profit before tax 105 173
Tax (21) (52) Profit after tax 84 121
Minority interests (1) (1) Profit for the period 83 120
Earnings per share (p) (basic) 2.1p 2.9p
Dividend per share 1.35p 1.35p
9
Movements in EBITA in the half year
151 202
2 12 34 5 2
50 100 150 200
2006 EBITA ITV1 ITV Channels GMTV Consumer CSA 2007 EBITA
*Before exceptional items
10
Interactive and Call TV effects
Interactive and Call TV revenues and profits from across the group 6 months to 30th June £m 2007 2006 % Change ITV (PRTS, SMS, Red button) 19 20
GMTV 5 8
ITV Play (Call TV) 9 26
Revenues 33 54
Operating profit ITV (PRTS, SMS, Red button) 4 7
GMTV (1) 6
3 22
11
£m Cash Date Liverpool (9.99% stake) 17 6th Feb 07 Arsenal (9.99% stake + option) 50 5th April 07 Property and transmission assets 9 Total 76 Non-core assets remaining: Screenvision, property, CSA.
Disposals
12 *Includes disposal of Seven Network, Education and O21
6 months to 30th June - £m 2007 2006 EBITDA 166 217 Working capital (33) (35) Cash generated from operations 133 182 Exceptional items (16) (13) Taxation and interest (32) (60) Capital expenditure (23) (55) Sale/purchase of businesses, investments and assets 73# 114* Equity dividends (55) (61) Other movements (14) (30) Movement in net debt 66 77
Net debt reduced
#Includes Disposal of Liverpool, Arsenal, various properties and purchase of Jaffe Braunstein
13
117 106 162 285 17
100 200 300 400 500 31.12.06 £17m cash contribution Asset/liability movement 30.06.07 30.06.07 Proforma Deficit post tax
* * H1 2007 £m Movement in net debt 66 Opening net debt (734) Closing net debt (668)
Net debt and Pension deficit
H1 2007 £m Current service cost (9) Net interest credit 9 Total income statement
£m
IAS 19 deficit reducing during the period
#
14
Operating efficiencies on track Operating cost savings 2006 2007 2008 Back Office 2 9 14 Property 2 4 Systems and Technology 4 7 Transmission 6 7 Staff Related 4 6 Procurement 1 2 Cumulative total 2 26* 40 Cumulative cost of change 7 15 24
Operating efficiencies
* £24m incremental savings – H1 £11m and H2 £13m
15
Kingdom
16
6 months to 30th June - £m
2007 2006 Change % ITV1 NAR 595 654
ITV2, 3, 4, News, CITV, M&M NAR 95 70 36% GMTV NAR 27 28
ITV plc NAR 717 752
Sponsorship 25 23 9% Media sales/other income 52 57
Total 794 832
Broadcasting revenue
17
Programming costs
6 months to 30th June - £m 2007 2006 Change % Commissions 291 257 13% Sport 48 103
Acquired 15 24
ITN news & weather 17 19
ITV plc share of ITV1 371 403
Regional news & non news 55 58
ITV plc share of ITV1 inc regional 426 461
ITV2, 3, 4, CITV, M&M 51 30 70% GMTV 17 18
Total ITV plc Schedule Costs 494 509
18 Source: BARB ITV digital channels = ITV2, ITV2+1,ITV3,ITV3+1,ITV4,GMTV2,GMTV2+1,M+M, and CITV, Individuals All Time, Jan-Jun 2007 vs Jan-Jun 2006.
Year on year percentage change in share of viewing
15.1 11.4
5 10 15 20 BBC1 BBC2 ITV1 C4 Five Digital Channels ex ITV ITV Digital Channels
c.284
Channels
Channel H1 % share
22 9 18 9 5 32 4 % change
Individuals
19
ITV the largest commercial family of channels ITV family SOCI in multi-channel homes H1 2007:
10 20 30 40 50
ITV C4 five Sky Sold IDS
2006 Family Channels 2007 Family Channels 2006 Primary Channel 2007 Primary Channel
%
Source: BARB/Infosys, Adult SOCI, ITV Family = ITV1/ 2/2+1/3/3+1/4/CITV/M&M/ GMTV1/2/2+1, Jan-Jun 07 vs. Jan-Jun 06
All time adult SOCI in multi-channel homes
20
2 22 1 3 5 18 57 203 42 88 137 228 307 392 474 633 861
100 200 300 400 500 600 700 800 900 1000 11m+ 10m+ 9m+ 8m+ 7m+ 6m+ 5m+ 4m+ 3m+
Five C4 ITV1
Number of Programmes exceeding given audience volume by channel
Source: BARB/Infosys, Individuals, All Time, programmes > 10 minutes duration, Jan-Jun 07
ITV1’s USP is delivering mass commercial audiences
H1 2007
21
0.1
3.8 2.6 24.7 0.6
5 10 15 20 25 30
January February March April May June H1 1st-29th July 1st Jan to 29th July
Year on year % change in ITV1 volume of adult impacts
Source: BARB/Infosys, Adults, All Time
ITV1 is delivering impact volumes
% change
22
Current performance encouraging ITV1 Weekly SOCI Performance YTD
26 28 30 32 34 36 38 40 1 3 5 7 9 11 13 15 17 19 21 23 25 27 29 31 33 35 37 39 41 43 45 47 49 51
Week
ITV1 2007 ITV1 2006
Source: BARB DDS, Adults, Wks 1-52 2006, wks 1-30 2007.
23
ITV2/3/4 increasing revenue and impacts
ITV Channels (excl ITV1) yoy all time adult SOCI growth in all Homes
2 4 6 8
2002 2003 2004 2005 2006 H1 2007
GMTV1 ITV dig channels
Source: BARB/Infosys Messages Analysis, Adult SOCI, ITV Channels = ITV2/2+1/3/3+1/4/News/CITV/M&M/ GMTV1/2/2+1
% SOCI
24
Housewife 49
25
6 months to 30th June - £m 2007 2006 Change % Production UK production (excl ITV supply) 19 32
Resources 11 10 10% Worldwide International production 34 31 10% Distribution and exploitation 53 54
Total (excl ITV supply) 117 127
ITV supply 164 180
Total 281 307
Production/Worldwide revenue
These numbers do not include any contributions from O21 or Granada Learning
26
Off-ITV production Content revenues will be H2 weighted
27
28
6 months to 30th June - £m 2007 2006 Change % Interactive and Call TV businesses Interactive (PRTS/SMS/Red Button) 19 20
ITV Play (Call TV) 9 26
Internet businesses ITV.com/ITV Local 4 2 100% Friends Reunited 11 8 38% Other consumer businesses SDN 13 12 8% Other 1 1
Consumer revenues
29
Significant on-line development
ITV.com – the most comprehensive TV site on the web
ITV.com - Launched on 31st July
Oct’07
30
Friends Reunited
2007 HY results – strong growth
family tree lifelines
EBITA margin in 2007
31
Opportunities
ITV on-line presence firmly established 8.5 million
ITV total unique users across all sites
32
continues to grow
as quickly as possible
with Arqiva on 27th July
2 4 6 8 10
Q1, 2004 Q3, 2004 Q1, 2005 Q3, 2005 Q1, 2006 Q3, 2006 Q1, 2007 Q3, 2007 (E)
Sky Pay Freeview Cable
Digital platform penetration
33
Robbie Coltrane: B road Britain
34
% change Jul Aug Sep Q3 ITV1 +11
+2 +1 Total ITV +14
+4 +4 Total UK TV +12
+7 +6
Source: BARB DDS (Jan-July 29th), ITV Family = ITV1/ 2/ 2+1/ 3/ 3+1/ 4/ Men & Motors, GMTV1/ 2/ 2+1 & CITV ITV Revenue estimates as of 06.08.07 ITV NAR excludes, Total TV includes, own spend,
5 10 Jun-06 Sep-06 Dec-06 Mar-07 Jun-07 Sep-07
Rolling 3 month y on y % change in UK TV NAR
35
36
ITV is providing the following cautionary statement. This document contains certain statements that are or may be forward-looking with respect to the financial condition, results or operations and business of ITV. By their nature forward-looking statements involve risk and uncertainty because they relate to events and depend on circumstances that will occur in the future. There are a number of factors that could cause actual results and developments to differ materially from those expressed or implied by such forward- looking statements. These factors include, but are not limited to (i) adverse changes to the current outlook for the UK television advertising market, (ii) adverse changes in tax laws and regulations, (iii) the risks associated with the introduction of new products and services, (iv) pricing, product and programme initiatives of competitors, including increased competition for programmes, (v) changes in technology or consumer demand, (vi) the termination or delay of key contracts and (vii) fluctuations in exchange rates.
37
The man who lost his head
38
2007 2006 Broadcasting revenue 794 832 Content revenue - total 281 307 Less internal (164) 117 (180) 127 Consumer revenue (excl Friends) 46 61 Other * 5 6 Producer/Broadcaster Total 962 1,026 CSA, Friends and Education# 42 51 Total 1,004 1,077
*Property rents received and O21 #Education in 2006 only
6 months to 30th June - £m
Revenues – published segmental reporting
39
Revenues 1,004 1,004 Operating EBITA 141 10 151 Amortisation (56) 56 JV’s and Associates 2 2 Investment Income 1 1 Gain on sale of property 9 (9) Gain on sale of subsid. & Investments 35 (35) PBIT 132 10 (35) (9) 56 154 Interest (27) (27) Profit before tax 105 127 Tax (21) (3) (11) (3) (38) Profit after tax 84 7 (35) (9) 45 (3) 89 Minority Interests (1) (1) Earnings 83 88 Weighted average 3,875 3,875 EPS 2.1p 2.3p
2007
Per Interim Operating Gain on sale Gain on sale Amortisation Other Adjusted Report Exceptional
Tax Items & investments Adjustments
Movement from reported to adjusted
40
Revenues 1,077 1,077 Operating EBITA 191 11 202 Amortisation (28) 28 JV’s and Associates 4 4 Investment Income 2 2 Gain on sale of property 4 (4) Loss on sale of subsid. & investments 17 (17) PBIT 190 11 (17) (4) 28 208 Interest (17) (17) Profit before tax 173 191 Tax (52) 5 (8) (55) Profit after tax 121 11 (12) (4) 20 136 Minority Interests (1) (1) Earnings 120 135 Weighted average 4,105 4,105 EPS 2.9p 3.3p
2006
Per Interim Operating Gain on sale Gain on sale Amortisation Adjusted Report Exceptional
Items & investments
Movement from reported to adjusted
41
Retail 93 16%
Food 61 10%
Finance 60 10%
Cars & Car Dealers 52 9%
Cosmetics & Toiletries 45 7%
Entertainment & Leisure 33 6%
Household Stores 36 6% 1% Telecommunications 35 6% 5% Pharmaceuticals 24 4% 9% Publishing and Broadcasting 23 4% 13%
Broadcasting revenue
H1 2007 Revenue £m* % of NAR Category
Source: Datawarehouse, Jan-Jun 2007, * ITV1 plc
% growth/ decline yoy
Top 10 advertising categories
42
Programming costs
6 months to 30th June - £m 2007 2006 Change % Commissions 291 257 13% Sport 48 103
Acquired 15 24
ITN news & weather 17 19
ITV plc share of ITV1 371 403
Regional news & non news 55 58
ITV plc share of ITV1 inc regional 426 461
ITV2, 3, 4, CITV, M&M 51 30 70% GMTV 17 18
Total ITV plc Schedule Costs 494 509
Minority share of ITV1 NPB 27 30
Total 521 539
43
6 months to 30th June - £m 2007 2006 Saving Cash bid payment 2 2
21 27 6 Adjustment in respect of prior years
(6) Total 23 23
Licence fees
44
ITV share of results – EBITA
6 months to 30th June - £m
2007 2006 JVs Screenvision 2 3 Associates ITN
Other 1 1 Interest and Tax (1) (3) Total 2 3 Investment income SMG/Other 1 Seven Network* 1 1 Total 1 2
*Disposed of in 2006
45
Operating exceptional items 6 months to 30th June - £m 2007 2006 Reorganisation and integration costs (1) (2) Carlton Screen Advertising contract provision (9)
Fees in relation to takeover approaches
Total exceptional items (10) (11)
46
6 months to 30th June - £m 2007 2006 Tax charge (31) (37) Deferred tax 7 (15) Prior period adjustments 3
(21) (52) Overseas tax payments (3) Cash payments relating to 2006 paid in 2007 (4) Cash repayments re prior periods 12 Net cash receipts in 2007 5
47
£m Profit before tax as reported 105 Exceptional items (net) (34) Amortisation 56 Share of profits of joint ventures and associates (2) Profit before tax, exceptional items, amortisation 125 and share of profits of JV’s and associates Tax charge as reported 21 Net credit for exceptional items 3 Credit in respect of amortisation 11 Credit in respect of prior period items 3 Underlying tax charge 38 Underlying rate of tax 30%
48
6 months to 30th June - £m
2007 2006 €355.7m Exchangeable at 2.25% Jan 07
£200m at 7.625% Jun 07 (7) (7) £250m at 5.625% Mar 09 (7) (7) €500m Eurobond at 4.75% Oct 11 (8)
(9) (9) £250m Eurobond at 6.125% Jan 17 (8)
(26) Swap/Bond fair value movements (9) (3) Imputed interest on net pension deficit 9 8 Interest on cash and other 12 4 P&L charge (27) (17) Cash - Imputed interest on net pension deficit (9) (8) Swap and bond fair value and timing differences (1) 9 Property discounting
Cash interest (37) (15)
49
Cash/Debt position
Medium Term financing secured
£334m
£248m
£240m
£200m
Gross Debt £1,250m less Cash £582m Net Debt £668m
Interim 07 Net Debt
50
£m June 2007 Dec 2006 €355.7m Exchangeable Jan 07
£250m Eurobond Jun 07
£200m Eurobond Mar 09 247 248 €500m Eurobond+ Oct 11 334 334 £325m Eurobond Oct 15 322 322 £250m Eurobond+ Jan 17 248 248 Other loans & loan notes 26 27 Finance leases# 73 75 Cash & cash equivalents (582) (961 ) Statutory net debt 668 734
+ Issued in October 2006
# Finance leases predominantly associated with sale and leasebacks of programmes and matched by equal cash deposits
51
Sustainability Index 2006 for second year running.
2006 CR Index.
52
On air:
Difference”
about climate change by visiting www.itvclimatechange.com and pledging to take up one of ten energy saving challenges
increasing access for viewers
launched 11 July, part of the Pride of Britain Awards
Behind the Scenes:
including energy efficiency, renewable electricity and climate change issues
scheme for employees with matched funding
activities see
www.itvplc.com/itv/responsibility/