SLIDE 1
Interpolating a Discrete Set of Data - Section 4.2 Question 4.1
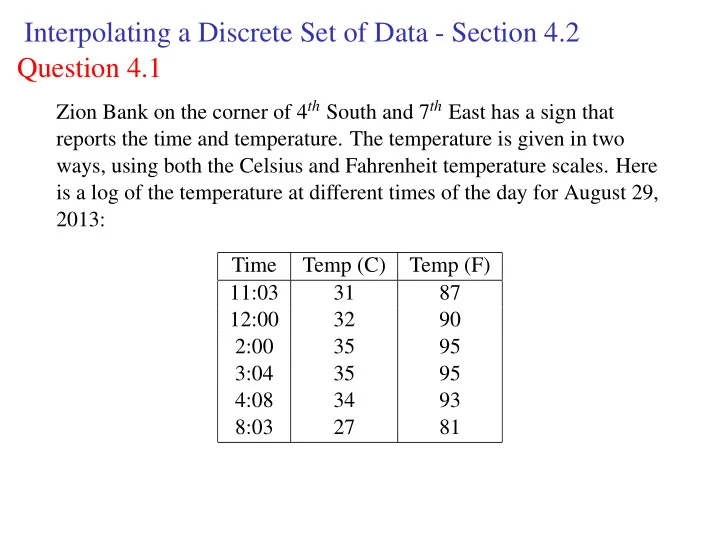
Zion Bank on the corner of 4th South and 7th East has a sign that reports the time and temperature. The temperature is given in two ways, using both the Celsius and Fahrenheit temperature scales. Here is a log of the temperature at different times of the day for August 29, 2013: Time Temp (C) Temp (F) 11:03 31 87 12:00 32 90 2:00 35 95 3:04 35 95 4:08 34 93 8:03 27 81
SLIDE 2 Interpolating a Discrete Set of Data - Section 4.2 Question 4.1
The weather report said that the low for the night had been 74◦ F at 4 : 30 am and the high for the day was 97◦ F at 3 : 30pm. Using the information in the table, estimate what you think the Celsius readings
- n the bank sign would have been at those two times. Explain how
you got your answers.
SLIDE 3 Interpolating a Discrete Set of Data - Section 4.2 Question 4.1
Use the coordinate systems below to plot the data. There are few issues that you should be paying attention to:
- a. Choose an appropriate scale
and plot the points that show how the Celsius temperature changes with time. Your first point will be (11 : 03,31).
SLIDE 4 Interpolating a Discrete Set of Data - Section 4.2 Question 4.1
Use the coordinate systems below to plot the data. There are few issues that you should be paying attention to:
- b. Plot the points that show
how the Fahrenheit temperature changes with
- time. Your first point will be
(11 : 03,87).
SLIDE 5 Interpolating a Discrete Set of Data - Section 4.2 Question 4.1
- c. Write a short description of what your graphs show. Compare
the two graphs.
SLIDE 6
Interpolating a Discrete Set of Data - Section 4.2 Question 4.2
So far we have observed how the temperature reported in different scales depended on time. Now we will see how the Fahrenheit temperature changes with respect to the Celsius temperature. As before, choose an appropriate scale and plot the points from the table. Your first point will be (31,87).
SLIDE 7 Interpolating a Discrete Set of Data - Section 4.2 Question 4.2
- a. The points of your graph should fall approximately in a straight
- line. Draw a straight line that seems to go through most of the
points.
SLIDE 8 Interpolating a Discrete Set of Data - Section 4.2 Question 4.2
- b. What is the Fahrenheit temperature when the Celsius
temperature is 25◦?
- c. What is the Celsius temperature when the Fahrenheit
temperature is 50◦?
- d. Is there a temperature where a Fahrenheit and Celsius
thermometer show the same number? If so, what is it?
SLIDE 9
Interpolating a Discrete Set of Data - Section 4.2 Question 4.3
If you increase the Fahrenheit temperature by one degree, by how much does the temperature increase on the Celsius scale?
SLIDE 10 Interpolating a Discrete Set of Data - Section 4.2 Question 4.3
- a. Explain how you know whether your answer to the previous
question is accurate.
- b. How would your answer be different if you knew that 25◦C is
77◦F, and that 50◦C is 122◦F?
SLIDE 11 Interpolating a Discrete Set of Data - Section 4.2 Question 4.4
We want to come up with a general rule such that if we know the temperature in Fahrenheit we can calculate the temperature in Celsius.
- a. From Question 4.3 we know the effect of increasing the
Fahrenheit temperature by one degree on the temperature in Celsius.
- b. Write down a rule that converts the temperature in Fahrenheit to
the temperature in Celsius.
SLIDE 12
Interpolating a Discrete Set of Data - Section 4.2 Question 4.5
Use the function you just obtained to find the rule that converts the temperature in Fahrenheit to the temperature in Celsius.
SLIDE 13 Interpolating a Discrete Set of Data - Section 4.2 Question 4.6
There is another temperature scale called Kelvin. The scale is used because 0◦ Kelvin is the minimum temperature a system can have. If the temperature increases by one degree Kelvin, then the temperature also increases by one degree Celsius. Use the fact that −273.15◦C = 0◦K.
- a. Find a function g that represents the conversion between Celsius
and Kelvin.
- b. Find a function h that represents the conversion between
Fahrenheit to Kelvin.
- c. What is another way you can answer the previous question?
SLIDE 14
Slope - Section 4.3 Question 4.7
Kingda Ka is a steel accelerator roller coaster located at Six Flags Great Adventure in Jackson, New Jersey, United States. It is the world’s tallest roller coaster, the world’s second fastest roller coaster, and was the second strata coaster ever built. The steepest portion of Kingda Ka is a 418 foot drop. During the 418 foot drop the train moves 25 feet horizontally.
SLIDE 15 Slope - Section 4.3 Question 4.7
- a. Is there enough information to determine which roller coaster is
steeper?
- b. If so calculate which coaster is steeper.
- c. Is steepness all you look for in a roller coaster?
SLIDE 16
Slope - Section 4.3 Definition of slope.
Definition
The slope of a line segment is defined as the ratio of rise to run: slope = rise run
SLIDE 17 Slope - Section 4.3 Question 4.8
Steep roads sometimes have a sign indicating how steep they are. For example, the sign may say 5% Grade. This means that you gain 5 units of altitude (the rise) for every 100 units you move in the horizontal direction (the run).
- a. On a 5% grade, how many units of altitude do you gain for every
200 units you move in the horizontal direction.
- b. On a 5% grade, how many units in the horizontal direction would
you have to move to increase your altitude by 100 units?
- c. How would a mathematician report a 5% grade? What is the
corresponding slope?
- d. If the road up Little Cotton Wood Canyon travels 8.26 miles
horizontally and the elevation change is about 4000 feet, what is the average grade of canyon road? What is the average slope? (Use the fact that there are 5280 feet in a mile)
- e. What is the grade when you are driving on the Salt Flats?
SLIDE 18 Slope - Section 4.3 Question 4.8
Steep roads sometimes have a sign indicating how steep they are. For example, the sign may say 5% Grade. This means that you gain 5 units of altitude (the rise) for every 100 units you move in the horizontal direction (the run).
- a. On a 5% grade, how many units of altitude do you gain for every
200 units you move in the horizontal direction.
SLIDE 19 Slope - Section 4.3 Question 4.8
Steep roads sometimes have a sign indicating how steep they are. For example, the sign may say 5% Grade. This means that you gain 5 units of altitude (the rise) for every 100 units you move in the horizontal direction (the run).
- b. On a 5% grade, how many units in the horizontal direction would
you have to move to increase your altitude by 100 units?
SLIDE 20 Slope - Section 4.3 Question 4.8
- c. How would a mathematician report a 5% grade? What is the
corresponding slope?
SLIDE 21 Slope - Section 4.3 Question 4.8
- d. If the road up Little Cotton Wood Canyon travels 8.26 miles
horizontally and the elevation change is about 4000 feet, what is the average grade of canyon road? What is the average slope? (Use the fact that there are 5280 feet in a mile)
SLIDE 22 Slope - Section 4.3 Question 4.8
- e. What is the grade when you are driving on the Salt Flats?
SLIDE 23 Slope - Section 4.3 Question 4.9
A B C
- a. Find the slope of each hypotenuse in the above figure.
SLIDE 24 Slope - Section 4.3 Question 4.9
A B C
- a. Which triangle has the steepest hypotenuse?
- b. Two of the triangles’ hypotenuse have the same slope. Why
might someone make the mistake and report all three of the triangles have the same slope?
SLIDE 25 Slope - Section 4.3 Question 4.10
- a. Draw a triangle on the geoboard that would have a hypotenuse
with the largest possible slope. Calculate the slope of the figure you drew. Explain how you know it is the requested triangle.
SLIDE 26 Slope - Section 4.3 Question 4.10
- b. Draw a triangle on the geoboard that would have a hypotenuse
with the smallest possible slope. Calculate the slope of the figure you drew. Explain how you know it is the requested triangle.
SLIDE 27 Slope - Section 4.3 Question 4.10
- c. List all the possible slopes of the triangles you can draw on the
- geoboard. Report them as fractions.
SLIDE 28 Slope - Section 4.3 Question 4.10
What can you say about the slope of a line if, when you follow the line from left to right
- a. It goes up?
- b. It goes down?
- c. It doesn’t go up or down?
SLIDE 29 Slope - Section 4.3 Question 4.12
What can you say about the slope of a line that does not contain any points in the
- a. First quadrant.
- b. Second quadrant.
- c. Third quadrant.
SLIDE 30 Lines - Section 4.4 Question 4.14
For each equation below find two pairs of numbers, (x,y), that satisfy the equation. Label the two points and calculate the slope of the line segment that connects the two points.
- a. y = 1.5x+3
- b. y = −1.5x+3
- c. y = 2x+3
- d. y = −3x+3
- e. How did your answer compare to people who chose different
points?
SLIDE 31 Lines - Section 4.4 Question 4.14
For each equation below find two pairs of numbers, (x,y), that satisfy the equation. Label the two points and calculate the slope of the line segment that connects the two points.
SLIDE 32 Lines - Section 4.4 Question 4.14
For each equation below find two pairs of numbers, (x,y), that satisfy the equation. Label the two points and calculate the slope of the line segment that connects the two points.
SLIDE 33 Lines - Section 4.4 Question 4.14
For each equation below find two pairs of numbers, (x,y), that satisfy the equation. Label the two points and calculate the slope of the line segment that connects the two points.
SLIDE 34 Lines - Section 4.4 Question 4.13
The slope between two points is the quotient of the difference between their y-coordinates and the difference between their x-coordinates ( ∆y
∆x).
- a. What does this mean for the slope of a vertical line?
- b. What does this mean for the slope of a horizontal line?
SLIDE 35 Lines - Section 4.4 Question 4.14
For each equation below find two pairs of numbers, (x,y), that satisfy the equation. Label the two points and calculate the slope of the line segment that connects the two points.
SLIDE 36 Lines - Section 4.4 Question 4.14
For each equation below find two pairs of numbers, (x,y), that satisfy the equation. Label the two points and calculate the slope of the line segment that connects the two points.
- e. How did your answer compare to people who chose different
points?
SLIDE 37
Lines - Section 4.4 Question 4.15
Find two (x,y) pairs that satisfy the equation y = mx+b (your pairs should be in terms of m and b). Use the pair of points to calculate the slope of the line segment connecting the two points.
SLIDE 38
Lines - Section 4.4 Question 4.16
Given an equation for a line y = .5x+3, how do you calculate the y-intercept? Explore both a geometric technique and an algebraic technique.
SLIDE 39
Lines - Section 4.4 Question 4.17
Given an equation for a liney = mx+b, calculate the y-intercept. Did you use an algebraic or geometric approach?
SLIDE 40 Lines - Section 4.4 Question 4.18
Fill out the following tables.
x y 1 2 3 x y 2 4 6 x y 1 3 6 8
SLIDE 41 Lines - Section 4.4 Question 4.18
Fill out the following tables.
x y 1 2 3 x y 2 4 6 x y 1 3 6 8
SLIDE 42 Lines - Section 4.4 Question 4.18
Fill out the following tables.
x y 1 2 3 x y 2 4 6 x y 1 3 6 8
SLIDE 43
Lines - Section 4.4 Question 4.18
When x = 0, what is y? When x increases by 1, how much does y increase? (If y decreases, think of it as a negative increase.) a . b . c . Where do you find that number in each of the tables for each equation?
SLIDE 44 Lines - Section 4.4 Question 4.19
In the 2013-2014 academic year the tuition to attend the University of Utah is $6400 a year (for 12 credits a semester). In the 2012-2013 academic year the cost of tuition was $6000 a year (for 12 credits a semester).
- a. Suppose that a linear function can model the tuition at the U.
What will the tuition cost for the academic year 2014−2015 (for 12 credits a semester)?
- b. Write down a function f such that f(t) represents the tuition in
the academic year t (for 12 credits a semester). Discuss what a reasonable domain might be for your function by thinking about what f(0) what f(10000000) would represent.
- c. For what values of t will f(t) be most accurate?
- d. In what year will tuition cost $10000 per semester? (according to
- ur model)
SLIDE 45 Lines - Section 4.4 Question 4.19
In the 2013-2014 academic year the tuition to attend the University of Utah is $6400 a year. In the 2012-2013 academic year the cost of tuition was $6000 a year .
- a. Suppose that a linear function can model the tuition at the U.
What will the tuition cost for the academic year 2014−2015 (for 12 credits a semester)?
SLIDE 46 Lines - Section 4.4 Question 4.19
In the 2013-2014 academic year the tuition to attend the University of Utah is $6400 a year. In the 2012-2013 academic year the cost of tuition was $6000 a year.
- b. Write down a function f such that f(t) represents the tuition in
the academic year t (for 12 credits a semester). Discuss what a reasonable domain might be for your function by thinking about what f(0) what f(10000000) would represent.
SLIDE 47 Lines - Section 4.4 Question 4.19
In the 2013-2014 academic year the tuition to attend the University of Utah is $6400 a year. In the 2012-2013 academic year the cost of tuition was $6000 a year.
- c. For what values of t will f(t) be most accurate?
SLIDE 48 Lines - Section 4.4 Question 4.19
In the 2013-2014 academic year the tuition to attend the University of Utah is $6400 a year. In the 2012-2013 academic year the cost of tuition was $6000 a year.
- d. In what year will tuition cost $10000 per semester? (according to
- ur model)