
SLIDE 1
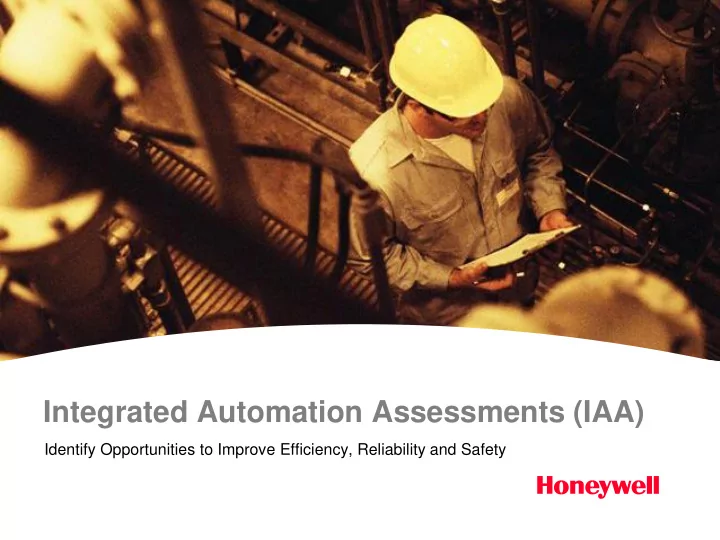
Integrated Automation Assessments (IAA)
Identify Opportunities to Improve Efficiency, Reliability and Safety
Integrated Automation Assessments (IAA) Identify Opportunities to - - PowerPoint PPT Presentation
Integrated Automation Assessments (IAA) Identify Opportunities to Improve Efficiency, Reliability and Safety Know Where You Stand Assess your control system Assess your control performance Assessing Your Control System Security
Identify Opportunities to Improve Efficiency, Reliability and Safety
– Security Patches – Antivirus Signatures
– Baseline Performance – Track Conditions
– Check Against Best Practices
– Supportability Status – Risk to Plant Operations – Cost to Maintain & Support – Technology Refresh
Executive Summary LCN Network Health
Network Health
Healthy Caution Poor System Performance Baseline for Company ABC
Experion System CONFIGURATION Assessment
PC Performance
|
Server Communications Performance
|
Sw itch Performance
|
Controller Performance
|
Experion System PERFORMANCE Assessment Reviewed by Certified Engineers Analyzed by Global TAC
FTE Netw ork Configuration
|
Experion Controller Configuration
|
Experion Client Server Configuration
|
HMI Display Configuration
|
Back Up and Recovery Configuration
|
Overall LCN Loading
|
Overall UCN Loading
|
LCN Node Statistics
|
UCN Node Statistics
|
Nodes Exceeding Recommended Guidelines
|
Node Type Specific Reports
|
TPS Integration CONFIGURATION Assessment TPS System PERFORMANCE Assessment
Experion / TPS Integration Configuration
|
Security Configuration
|
Anti-Virus Status
|
Microsoft Security Updates
|
Installed Softw are
| SECURITY Assessment
Reviewed by Certified Engineers
Analyzed by Global TAC
Account Name Site Name Master Asset SID Last Audit Date AM AM-R (EAMR) AMC AMX APM APM-R APP CUSTOMER01 16/10/2009 2 1 4 CUSTOMER08 16/10/2009 2 2 1 6 Account Name Site Name Master Asset SID Last Audit Date HG HLPIU HMON HPM HPM-R LEPIU LLPIU CUSTOMER01 16/10/2009 6 4 19 5 CUSTOMER08 16/10/2009 5 4 3 11 2 11 4 7 30 7 Grand Total
IB Life Cycle Management traffic light 2
Dat e run: 0 5/ 0 2 / 2 0 10
Customer Madrid Grand Total Customer Madrid
Obsolescence Chart Detailed Assessment of the Supportability Status for Each Module & Controller Detailed Migration, Upgrades Options & Recommendations
TECHNOLOGY REFRESH OPTION: The GUS stations are under Windows XP, which is
after April 8, 2014, discontinued from Microsoft. This means that while the operating system may continue to operate beyond the end of life date, Microsoft will not release new security updates, security hot fixes, provide technical phone support, or online technical content
cyber security threats. Honeywell recommendation is to upgrade GUS to ES-Ts
BENEFITS: The ES-Ts will run on R410 and R430 under Windows 7 Operating System with full
support from Microsoft and Honeywell and will add the Experion console station functionality to the Native Window functionality. This new Experion functionality can be implemented on process,
Tagname DCSUnit ProcArea Description LoopType Performance Critica CritAreaOppor ValveSti OscillationPer CPI COV CHFC_007
CH ENERGIA CONTROL H2 CA flow poor 3 4 40 56 1m 50s 0.45 4.28
CHFC_008
CH ENERGIA CONTROL H2 LE flow poor 3 4 40 34 0m 8s 0.23 24.83
CHFC_014
CH ENERGIA LLCN A TANQUE flow poor 3 4 40 1 0m 25s 0.48 0.47
CHLC_002
CH ENERGIA NIV BOTELL CAR level acceptable 3 4 8 N/A 200m 6s 0.03 10.61
CHLC_024
CH ENERGIA CONTROL NIVEL level fair 3 4 32 N/A 502m 18s 0.04 7.57
CHLC_034
CH ENERGIA NIVEL ESTABILZ level acceptable 3 4 8 N/A 983m 33s 0.27 11.21
CHLC_037
CH ENERGIA DEPOSIT CONDE level fair 3 4 32 N/A 500m 0s 0.09 4.58
CHTC_005
CH ENERGIA CTROL TEMP EN temperature fair 3 4 32 N/A 999m 60s 0.3 38.31
CHTC_044
CH ENERGIA TEMP A SALIDA temperature fair 3 4 32 N/A 1000m 0s 0.01 11.66
CHTC_049
CH ENERGIA ENTRADA A REA temperature fair 3 4 32 N/A 999m 60s 0.02 22.15
CHTC_083
CH ENERGIA ENTRADA REAC temperature fair 3 4 32 N/A 1000m 0s 0.12 19.37
CHFC006A
CH ENERGIA CTROL CARGA H flow inactive none 1 none 1 3m 20s N/A
CHFC035A
CH ENERGIA SALIDA ENFRIAD flow inactive none 1 none 1 none N/A
CHFC040A
CH ENERGIA NAFTA INERTE H flow inactive none 1 none 1 none N/A
CHFC_001
CH ENERGIA HCN DE FCC
flow inactive none 1 none 1 33m 20s N/A
CHFC_002
CH ENERGIA LCN DE FCC
flow inactive none 1 none 1 0m 32s N/A
CHFC_004
CH ENERGIA MINIMO FLUJO flow saturated none 1 none 1 none N/A 0.68
CHFC_006
CH ENERGIA CONTROL CARG flow fair none 1 none 14 3m 47s 0.44 0.55
CHFC_013
CH ENERGIA REFLUJO A SPLI flow inactive none 1 none 9 0m 18s N/A 0.51
CHFC_015
CH ENERGIA MINIMO FLUJO flow acceptable none 1 none 7 1m 34s 0.27 0.45
CHFC_016
CH ENERGIA COND. MEDIA C flow acceptable none 1 none 1 5m 39s 0.77 0.56
CHFC_018
CH ENERGIA CARGA A R-2 LE flow excellent none 1 none 1 0m 31s 0.61 0.36
CHFC_019
CH ENERGIA CARGA A R-2 BY flow excellent none 1 none 1 0m 6s 0.63 0.42
Detailed Status Of All The Loops With Each Unit, With Direct Identification Of Oscillation Interactions And Sticky Valves
Non-invasive collectors gather a comprehensive data sample for
Data is encrypted and bundled then sent to Honeywell expert team for analysis and report generation Report is generated to summarize performance and highlight issues The report is presented in a consultative face-to-face environment with customer
3 days at site 8 days at back office
Standard Enhanced
X X
x x
x x
x x
x x
x x
x x
X X
x x
x x
X X
x x
X
X "Standard" IAA Pricing: EPKS TPS
Price Per System: Customers with existing SPB options in contracts:
"Enhanced" IAA Pricing: EPKS TPS
Price Per System: Customers with existing SPB options in contracts:
Optional:
Integrated Automation Assessment - IAA
qualified labor response
P1 & p2
Improvement
maintenance
monitoring
Indicators
CORRECTIVE
Performance
BEST PRACTICES
PERFORMANCE-BASED
TIME BASED
IAA LSS Solution Sustained Benefits
Up & Configuration
Performance
Maintenance
Services
Refresh
Services
Services
KPIs Management:
Typical Benefits: