
SLIDE 1
Insights from Sample Human Genome GWAS and Epigenome EWAS Projects - - PowerPoint PPT Presentation
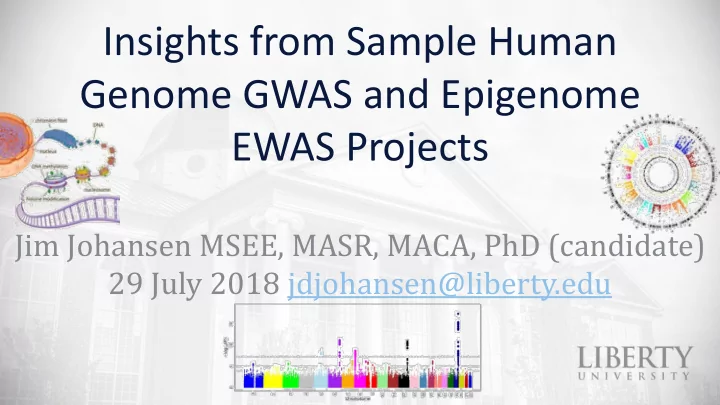
Insights from Sample Human Genome GWAS and Epigenome EWAS Projects Jim Johansen MSEE, MASR, MACA, PhD (candidate) 29 July 2018 jdjohansen@liberty.edu Overview (1 of 2) This presentation examines sample findings from recent genome- wide
– Several studies have shown statistically significant health impacts from individuals who have active experience with religiosity factors like, faith, prayer, and church attendance – There is room for more research in these interdisciplinary areas and are key in the author’s ongoing research
– Faith impact in health and behavior, even overriding genes
– Including “religiosity factors” as developed in the literature
T C A G T TTT Phe (F) TCT Ser (S) TAT Tyr (Y) TGT Cys (C) TTC TCC TAC TGC TTA Leu (L) TCA TAA Ter TGA Ter TTG TCG TAG Ter TGG Trp (W) C CTT Leu (L) CCT Pro (P) CAT His (H) CGT Arg (R) CTC CCC CAC CGC CTA CCA CAA Gln (Q) CGA CTG CCG CAG CGG A ATT Ile (I) ACT Thr (T) AAT Asn (N) AGT Ser (S) ATC ACC AAC AGC ATA ACA AAA Lys (K) AGA Arg (R) ATG Met (M) ACG AAG AGG G GTT Val (V) GCT Ala (A) GAT Asp (D) GGT Gly (G) GTC GCC GAC GGC GTA GCA GAA Glu (E) GGA GTG GCG GAG GGG
Double Helix Standard Codon Table Nucleotides Overlapping Protein Sequences
ataaatttgagtcagcaccagcgacagctctgcagtcctc tctacagaacaagacgacctttaagtttcccagagaaaa
G A C T A T A A A T G A Asn'(N) Ile'(I) Val'(V) Ile'(I) Ser'(S) Ter Ter Met'(M) Leu'(L) Lys'(K) Ser'(S) Tyr'(Y) Gln'(Q) Tyr'(Y) Lys'(K) Ter Asp'(D) Ile'(I) Asn'(N) Thr'(T)
Codons (3 nucleotides) Molecules Whole Genome: Functions utilize information from multiple locations Epigenetic Switching: Turns genes on and off
TATA Box
Molecules
Double Helix
Molecules
Codons
Nucleotides
frames
Standard Codon Table
Coding Alphabet
Overlapping Protein Sequences
Whole Genome Function
Genome
Epigenetic Switching
How can I be informed by my faith to better understand this holistically?
Processing Parts Assembled Human Genome by Chromosome Double Helix Structure
Overlap to piece parts together Break down biological sample
How Do We Access the Information?
https://en.wikipedia.org/wiki/P-value
T-K Clarke, et. al., “Genome-wide association study of alcohol consumption and genetic overlap with other health- related traits in UK Biobank (N=112117),” Molecular Psychiatry (2017) 22, 1376–1384
rs1260326
UK Biobank Alcohol Dependency
Manhattan plot generated with R and qqman library https://www.theoj.org/joss- papers/joss.00731/10.21105.joss.00731.pdf
Smallest p-val
CHR:BP:A1:A2 SNP AC ytx beta se tstat pval
1 11:42212601:G:T rs536162651 6.89E+02 7.07E+00 1.05E-02 1.57E-03 6.74E+00 1.59E-11 10.7998584 2 6:37931122:C:T rs375944322 2.33E+03 1.49E+01 5.13E-03 7.86E-04 6.53E+00 6.77E-11 10.1691253 3 19:52416150:G:A rs73934702 6.90E+02 6.94E+00 9.16E-03 1.48E-03 6.20E+00 5.51E-10 9.25866164 4 10:88091447:G:A rs146456009 2.11E+03 1.26E+01 5.45E-03 8.94E-04 6.09E+00 1.12E-09 8.94948104 5* 2:32562620:C:A rs192306272 6.93E+03 2.73E+01 2.92E-03 4.89E-04 5.98E+00 2.24E-09 8.65000216 6 2:32566261:C:T rs191444614 6.70E+03 2.65E+01 3.00E-03 5.03E-04 5.96E+00 2.46E-09 8.60917613 7 6:37845618:G:T rs56100008 1.87E+03 1.18E+01 5.05E-03 8.75E-04 5.77E+00 7.78E-09 8.10897184 8 4:180660418:A:G rs185393533 7.29E+02 6.25E+00 8.43E-03 1.50E-03 5.61E+00 2.07E-08 7.68318287 9 9:97632419:C:G rs573242084 1.60E+03 1.01E+01 5.58E-03 9.98E-04 5.59E+00 2.26E-08 7.64554964 10 12:107218409:G:A rs572148082 2.69E+03 1.44E+01 4.13E-03 7.51E-04 5.50E+00 3.90E-08 7.40851689 11 6:155624995:C:T rs181401718 1.39E+03 9.09E+00 5.92E-03 1.09E-03 5.42E+00 5.84E-08 7.23394351 12 2:32851160:T:C rs115405419 6.79E+03 2.50E+01 2.64E-03 4.94E-04 5.34E+00 9.43E-08 7.02538009 13 13:76501591:C:T rs192506791 1.97E+03 1.06E+01 4.97E-03 9.33E-04 5.32E+00 1.02E-07 6.99353396 14 3:15764003:A:G rs551069073 6.38E+02 5.51E+00 8.49E-03 1.60E-03 5.31E+00 1.11E-07 6.95629592 15 8:51397014:A:G rs117465326 3.21E+03 1.57E+01 3.72E-03 7.03E-04 5.29E+00 1.21E-07 6.91578131 16 3:99741230:T:C rs113097300 8.74E+02 6.98E+00 7.05E-03 1.33E-03 5.29E+00 1.22E-07 6.91244572 17 7:142612522:C:T rs150345829 1.18E+03 8.44E+00 6.06E-03 1.15E-03 5.26E+00 1.46E-07 6.83510016 18 8:51417816:T:A rs75873830 3.10E+03 1.50E+01 3.82E-03 7.27E-04 5.25E+00 1.49E-07 6.82809519 19 1:217190677:C:G rs182717155 1.32E+03 8.81E+00 5.69E-03 1.08E-03 5.25E+00 1.56E-07 6.80754127 20 3:17559724:G:T rs765174844 1.02E+03 8.01E+00 6.22E-03 1.20E-03 5.21E+00 1.91E-07 6.71837585
AD 20002 - Sample size of 337,159 * May correlates with Clarke’s UK Biobank Alcohol Consumption CHR 2 Region
CHR 2 RS1260326 is not included in the Neale Lab processed data
Q-Q plot generated with R and qqman library https://www.theoj.org/joss- papers/joss.00731/10.21105.joss.00731.pdf
process mechanisms? UK Biobank Alcohol Dependency
COGA DSM-IV Alcohol Dependency
J-C Wang, et. al., A genome-wide association study of alcohol-dependence symptom counts in extended pedigrees identifies C15orf53, Molecular Psychiatry (2012), 1–7
Histone, RNA, other
Coding Information Non-Coding Information Genome Gene methylate demethylate
Switch – turn on, off, or modify function
DNA Methylation
(Epi)Genetic Variation: What may happen
Methylation - Flexible cellular dynamic adaption
Characteristics of the cellular system
https://pubs.niaaa.nih.gov/publications/arcr351/6-16.htm
T C A G T TTT Phe (F) TCT Ser (S) TAT Tyr (Y) TGT Cys (C) TTC TCC TAC TGC TTA Leu (L) TCA TAA Ter TGA Ter TTG TCG TAG Ter TGG Trp (W) C CTT Leu (L) CCT Pro (P) CAT His (H) CGT Arg (R) CTC CCC CAC CGC CTA CCA CAA Gln (Q) CGA CTG CCG CAG CGG A ATT Ile (I) ACT Thr (T) AAT Asn (N) AGT Ser (S) ATC ACC AAC AGC ATA ACA AAA Lys (K) AGA Arg (R) ATG Met (M) ACG AAG AGG G GTT Val (V) GCT Ala (A) GAT Asp (D) GGT Gly (G) GTC GCC GAC GGC GTA GCA GAA Glu (E) GGA GTG GCG GAG GGGOther forms of methylation
Methylation
More speculative
Epigenomics Consortium generated the largest collection so far of human epigenomes for primary cells and tissues.
information is key for understanding gene regulation, cellular differentiation and human disease
111 Reference Human Epigenomes
https://www.nature.com/articles/nature14248
Randolph Byrd, MD. July 1988 • Southern Medical Journal • Vol. 81, No. 7 Epigenetic Process?
Bruce Epperly, Journal of Religion and Health, Vol. 39, No. 1, Spring 2000 Epigenetic Process?
Zaje Harrell, Kandace Powell, J Relig Health (2014) 53:895–903 DOI 10.1007/s10943-013-9683-4 Epigenetic Process?
https://www.sciencedaily.com/releases/2013/07/130703101344.htm https://www.med.lu.se/english/news_archive/130704_epigenetic_changes
– Our body systems work together at various levels – Cells have multiple layers of complex functions
– There is a connection and interdependency between various systems – Examining these relationships is an interesting endeavor
– UK Biobank GWAS findings are based on preliminary assessments
– Epigenetics show how our bodies can adapt to many factors – physical, emotional, spiritual
consider the relationship between biology and spiritual activity
– Preliminary thoughts are outlined how genomic and epigenomic processes can be influenced by spiritual factors
rs1229984 (N=336,965)
CHR:BP:A1:A2 SNP AC ytx beta se tstat pval 1 4:100239319:T:C rs1229984 6.59E+05 2.02E+04
1.42E-03
7.98E-20 2 4:100248642:G:C rs145452708 6.82E+03 3.01E+02 1.36E-02 2.12E-03 6.40E+00 1.59E-10 3 4:100249726:G:A rs138495951 6.88E+03 3.02E+02 1.35E-02 2.12E-03 6.39E+00 1.71E-10 4 6:121690163:C:T rs145783810 2.65E+03 1.20E+02 1.75E-02 3.69E-03 4.75E+00 2.08E-06 5 15:41288239:G:C rs11854924 2.04E+05 6.63E+03 2.15E-03 4.58E-04 4.69E+00 2.73E-06 6 6:121572207:T:A rs185742437 1.58E+03 7.97E+01 2.14E-02 4.61E-03 4.65E+00 3.27E-06 7 4:100474179:A:C rs147825380 4.25E+03 1.83E+02 1.24E-02 2.68E-03 4.64E+00 3.41E-06 8 4:100451781:C:T rs188726265 4.26E+03 1.83E+02 1.24E-02 2.68E-03 4.64E+00 3.57E-06 9 4:100588827:G:A rs148960385 4.16E+03 1.80E+02 1.25E-02 2.70E-03 4.62E+00 3.85E-06 10 15:41312368:G:A rs28550294 2.04E+05 6.63E+03 2.11E-03 4.58E-04 4.61E+00 4.00E-06 11 15:41409821:G:A rs28539674 2.10E+05 6.81E+03 2.09E-03 4.54E-04 4.61E+00 4.04E-06 12 15:41399492:A:C rs28896021 2.10E+05 6.81E+03 2.09E-03 4.54E-04 4.60E+00 4.22E-06 13 10:87822636:C:T rs575652338 1.08E+03 5.82E+01 2.57E-02 5.59E-03 4.59E+00 4.50E-06 14 4:100465573:T:G rs543669349 4.25E+03 1.82E+02 1.23E-02 2.68E-03 4.58E+00 4.74E-06 15 4:100608799:G:A rs150848708 4.11E+03 1.77E+02 1.23E-02 2.71E-03 4.55E+00 5.34E-06 16 11:39096977:T:C rs10466397 1.56E+03 7.98E+01 2.00E-02 4.44E-03 4.50E+00 6.95E-06 17 15:41416276:T:C rs11858278 2.09E+05 6.78E+03 2.04E-03 4.55E-04 4.49E+00 7.26E-06 18 4:77190011:C:T rs140609514 1.11E+03 5.80E+01 2.41E-02 5.52E-03 4.37E+00 1.25E-05 19 4:46093713:T:A rs1497577 3.50E+05 1.05E+04
4.25E-04
1.49E-05 20 7:49084556:G:A rs141202752 1.78E+03 8.53E+01 1.86E-02 4.30E-03 4.32E+00 1.59E-05
(N=336,965)
rs1229984 (N=21,894)
CHR:BP:A1:A2 rsid AC ytx beta se tstat pval 1 4:100239319:T:C rs1229984 4.26E+04 2.25E+04 8.22E-02 1.46E-02 5.65E+00 1.61E-08 2 5:15977695:T:C rs115043397 4.44E+02 2.78E+02 1.11E-01 2.39E-02 4.64E+00 3.45E-06 3 9:106101691:T:C rs7037370 1.80E+04 9.70E+03 2.13E-02 4.79E-03 4.45E+00 8.52E-06 4 5:21721388:G:T rs113610964 1.11E+03 5.13E+02
1.50E-02
1.06E-05 5 5:21722005:T:C rs111817046 1.11E+03 5.14E+02
1.50E-02
1.15E-05 6 5:21722043:C:G rs111350442 1.11E+03 5.14E+02
1.50E-02
1.15E-05 7 5:21722064:A:T rs111399799 1.11E+03 5.14E+02
1.50E-02
1.20E-05 8 5:21723247:A:G rs112116090 1.11E+03 5.15E+02
1.51E-02
1.23E-05 9 6:71859846:C:T rs12202150 9.66E+02 4.47E+02
1.62E-02
1.29E-05 10 5:21723100:G:A rs17839334 1.11E+03 5.15E+02
1.51E-02
1.33E-05 11 5:21722186:T:G rs16888553 1.11E+03 5.14E+02
1.50E-02
1.35E-05 12 8:29033406:G:T rs193119386 6.97E+01 5.27E+01 2.82E-01 6.48E-02 4.35E+00 1.35E-05 13 5:21723548:G:C rs6876234 1.11E+03 5.15E+02
1.52E-02
1.43E-05 14 5:21723373:G:A rs6875917 1.11E+03 5.15E+02
1.51E-02
1.45E-05 15 5:21721814:A:T rs113146804 1.11E+03 5.15E+02
1.50E-02
1.49E-05 16 2:64224977:T:C rs147971440 1.76E+02 1.20E+02 1.67E-01 3.87E-02 4.32E+00 1.54E-05 17 5:21723311:A:G rs112089188 1.11E+03 5.15E+02
1.51E-02
1.56E-05 18 5:21723495:C:T rs6877295 1.11E+03 5.15E+02
1.52E-02
1.56E-05 19 2:64112337:C:T rs114190015 1.45E+02 1.01E+02 1.86E-01 4.31E-02 4.31E+00 1.63E-05 20 1:195322984:T:A rs1348101 1.32E+04 7.11E+03 2.19E-02 5.12E-03 4.28E+00 1.86E-05
(N=21,894)
clearance rate of alcohol from the liver. This SNP is also known as Arg48His, with the (G) allele corresponding to Arg & (A) to His.
especially two ADH2*2 alleles, i.e. genotypes rs1229984(A;G) or rs1229984(A;A) are more likely to find drinking unpleasant & have reduced risk for alcoholism.
https://www.snpedia.com/index.php/Rs1229984 https://www.ncbi.nlm.nih.gov/projects/SNP/snp_ref.cgi?rs=1229984
GrCh38
ADH1B ADH1B
DNA Methylation
ADH1B
DNA Demethaltion
Stop Drinking Spiritual Event DNA Predisposition Fetal Alcohol Exposure Assessing SNP RS1229984 (ADH1B Gene) GWAS Data Results
rs1229984 Would not like drinking Susceptible to drinking Reverted to drinking aversion
(N=336,965)
(N=11,101)
Pruned data
(N=11,101)
Pruned data
(N=11,101)
Pruned data
(N=11,101)
Pruned data
Jack Euesden, et. al., PRSice: Polygenic Risk Score software, Bioinformatics, 31(9), 2015, 1466–1468, doi: 10.1093/bioinformatics/btu848
Clarke, T-K., et. al. “Genome-wide association study of alcohol consumption and genetic overlap with other health-related traits in UK Biobank (N=112117).” Molecular Psychiatry (2017) 22, 1376–1384. Comstock, G. W., Paktridge, K. B. “Church Attendance and Health.” American Journal of Epidemiology Vol. 168, No. 7, Johns Hopkins Bloomberg School of Public Health 2008. DOI: 10.1093/aje/kwn326. Dick, D. M., Nasim, A., Edwards, A. C., Salvatore, J. E., Cho, S. B., Adkins, A., et al. (2014). “Spit for Science: launching a longitudinal study of genetic and environmental influences on substance use and emotional health at a large US university.” Front. Genet. 5:47. doi: 10.3389/fgene.2014.00047. El-Sayed, A. M. Haloossim, M. Galea R. Koenen. K. C. “Epigenetic modifications associated with suicide and common mood and anxiety disorders: a systematic review of the literature.” Biology of Mood & Anxiety Disorders 2012, 2:10 http://www.biolmoodanxietydisord.com/content/2/1/10. Epperly, B. G. “Prayer, Process, and the Future of Medicine.” Journal of Religion & Health, Vol. 39, No. 1, Spring 2000. Harrell, Z. A. T., Powell K. “The Relationship Between Parent and Student Religious Coping and College Alcohol Use.” J Relig Health (2014) 53:895–903. DOI 10.1007/s10943-013-9683-4. Hingson, R.W., Zha, W., and Weitzman, E.R. 2009. “Magnitude of and trends in alcohol-related mortality and morbidity among U.S. college students ages.” 18-24, 1998-2005. J. Stud. Alcohol Drugs Suppl. 16, 12–20. Jankowski, Peter J., Hardy, Sam A., Zamboanga, Byron L., Ham, Lindsay S. (2013), “Religiousness and hazardous alcohol use: A conditional indirect effects model.” Journal of Adolescence 36 (2013) 747–758. Johansen, J. D. “Applied Theology: Exploring the Utility of Theological Method in Scientific Research with Genomic Research as an Example.” Naturalism and Its Alternatives in Scientific Methodologies. Blythe Institute, 2016. Wang, J-C. et. al., A genome-wide association study of alcohol-dependence symptom counts in extended pedigrees identifies C15orf53, Molecular Psychiatry 2012, 1–7.