
SLIDE 1
Andreas Eckart I.Physikalisches Institut der Universität zu Köln
Max-Planck-Institut für Radioastronomie, Bonn
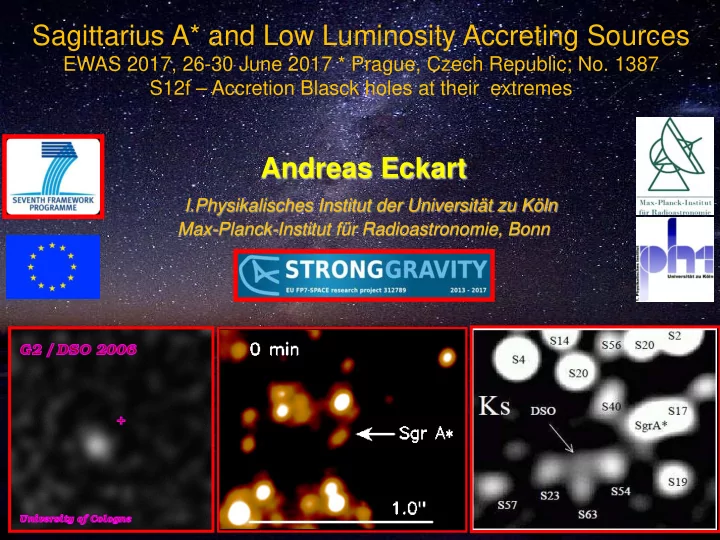
Sagittarius A* and Low Luminosity Accreting Sources
EWAS 2017, 26-30 June 2017 * Prague, Czech Republic; No. 1387 S12f – Accretion Blasck holes at their extremes