insight
play

Insight What were the 6 things from last weeks lecture that insight - PDF document

6/16/2015 2015 VisREU Site Agenda Introduction to Scientific Introduction to SciVis (High level) Visualization Using Visualization Applications Introducing ParaView Hands-on Test Drive Vetria L. Byrd, Director Advanced


  1. 6/16/2015 2015 VisREU Site Agenda Introduction to Scientific • Introduction to SciVis (High level) Visualization Using • Visualization Applications • Introducing ParaView • Hands-on Test Drive Vetria L. Byrd, Director Advanced Visualization VisREU Site Coordinator REU Site Sponsored by NSF ACI Award 1359223 “The purpose of visualization is “ insight” , not pictures.” High Level Overview INTRODUCTION ~Ben Shneiderman Explanation What’s Missing? Tells a Story . . . Insight What were the 6 things from last week’s lecture that insight leads to? 
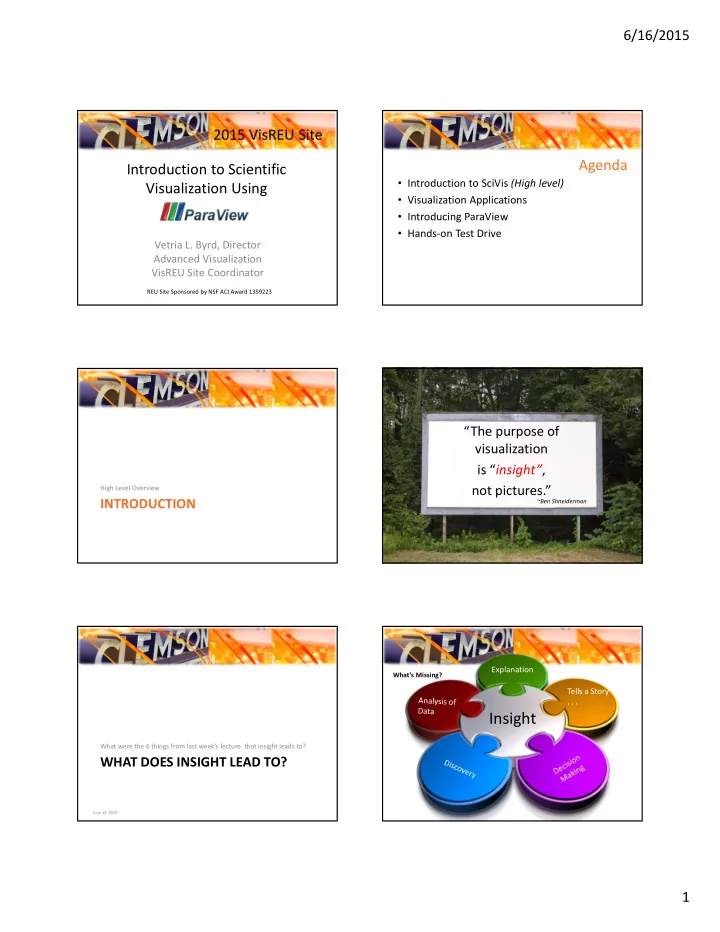
WHAT DOES INSIGHT LEAD TO? June 15, 2015 1

  2. 6/16/2015 Visualization Data Applications Visualization Process choose a basic Add methods for Input Data Research Fields An iterative process remove all but visual model, manipulating the � BioVis the data of such as a bar data or controlling Biological interest what features are graph, list or tree obtain the data Data visible Non- � InfoVis Numerical Data VISUALIZATION provide structure � GeoVis Geospatial improve the basic apply methods from representation to make it Data statistics or data mining to clearer and more visually Where are you in your discern patterns or place engaging the data in mathematical projects? Simulated, 3D � SciVis context Phenomena Visualizing Data: Exploring and Explaining Data with the Processing Environment by Ben Fry, O’Reilly (p 15) Scientific Scientific Visualization Visualization Pipeline Pipeline What’s Missing? http://www.bu.edu/tech/research/training/tutorials/introduction-to-scientific-visualization-tutorial/the-scientific-visualization-pipeline/ http://www.bu.edu/tech/research/training/tutorials/introduction-to-scientific-visualization-tutorial/the-scientific-visualization-pipeline/ Step 1: Produce Data • Simulated Data • Images • Numerical • Some measured value • Observed Phenomena WHAT DOES YOUR DATA LOOK LIKE? June 15, 2015 2

  3. 6/16/2015 Step 2: Analyze, Filter, Reformat Step 3: Apply SciVis Techniques • Cleaning up the data • Converts raw information – Removing noise into something more – Replacing missing values understandable – Clamping values to be • Visually extracting meaning within a specific range of from a scientific data set interest using various techniques • Performing operations to yield more useful data Streamlines Clip Threshold Glyphs Contour Step 4: Map to Geometry Step 5: Render, Post Process • Scalars, vectors, tensors • 1D, 2D, 3D • Mesh 2015 VisREU Site Step 6: View Results Introduction to Scientific Visualization Using 3

  4. 6/16/2015 • The process of visualization is taking raw data and converting • Basics of Visualization it to a form that is viewable and understandable to humans. • Scientific Visualization On Pipeline Basics of The Agenda • Features of ParaView Visualization • Introduction to ParaView • Additional Resources • There are a number of steps between raw Scientific Visualization data and a finished visualization • Primarily concerned with the visualization • Single tool or multiple tools might be used of three-dimensional phenomena (architectural, meteorological, medical, biological, etc.), • Where the emphasis is on realistic renderings of volumes, surfaces, illumination sources, and so forth, perhaps with a dynamic (time) component. Wikipedia.com • Open Source . . . It’s Free! • Multi-platform parallel data analysis and • http://www.paraview.org/ visualization application • Built upon the Visualization Toolkit (VTK) • Mature, feature-rich interface library • Good for general purpose, rapid visualization • Primary contributors: – Kitware, Inc. – Sandia National Laboratory – Los Alamos National Laboratory Mac Linux – Army Research Laboratory Windows 4

  5. 6/16/2015 Supported Data Types Supported Data Types Curvilinear – regularly gridded mesh shaping function applied Grid – regular structure, all voxels (cells) are the same size and shape Supported Data Types Supported Data Types • Point data • Polygonal data • Images • Multi-block • Adaptive Mesh Refinement (AMR) Unstructured grid – irregular mesh typically composed of tetrahedra, • Time series support prisms, pyramids, or hexahedra Supported Visualization Special Features • Isosurfaces Algorithms • Cutting planes • Supports derived variables • Streamlines • Scriptable via Python • Glyphs • Saves animations • Volume rendering • Can run in parallel / distributed mode for large • Clipping data visualization • Height maps • & more 5

  6. 6/16/2015 Supported File Formats Visualization Pipeline • All processing operations (filters) produce data sets • Can further process the result of every operation to build complex visualizations – Extract a cutting plane, – Apply glyphs (i.e. vector arrows) to the result • Gives a plane of glyphs through your 3D volume Many more . . . Demonstration Visualizing your Data Using ParaView • WRF weather forecast data set • Three Basic Steps: – Rectilinear grid – First your data must be read into ParaView – Multiple scalar and vector variables – Next, you may apply any number of filter s that – Time series process the data to generate, extract, or derive • Can show: features from the data – Clouds – Finally, a viewable image is render ed from the – Wind data – Temperature Sample Data Download from http://citi.clemson.edu/viz/sampleData.html – Find ParaView Section – Right click on headsq.vti – Save Link As: headsq – Save as type: VTI file (.vti) GETTING STARTED Remember where you save the data file! WITH PARAVIEW 3.14.1 June 15, 2015 6

  7. 6/16/2015 User Interface • File – Open - Menu Bar headsq.vti Tool Bars • Click Apply Pipeline Browser Object Inspector 3D View • Create an Isosurface – Click Filters – Common – Contour Should see an outline of the data set • A new object • Lets explore the appeared in the Isosurfaces section: pipeline browser – Value Range: [0, 4095] (Contour 1) – Default value: 2047.5 • Click Apply Contour – Extracts the points, curves, or surfaces where a scalar field is equal to a user- defined value. The surface is often also called an isosurface. 7

  8. 6/16/2015 Isosurfaces • Click Delete All • Click New Range Isosurfaces • Click Delete All • Click New Range • Add Range window appears – You can change the range of data values – For this tutorial, keep the default • Click OK Notice the range of values 8

  9. 6/16/2015 Clip Isosurface • Select Contour1 • Select Filters • Select Common • Select Clip CLIP - Intersects the geometry with a half space. The effect is to remove all the geometry on one side of a user- defined plane. This may take few seconds to render 9

  10. 6/16/2015 Drag arrow point around to front of surface (arrow turns red when selected) It may take a few seconds to render Depending on where you placed the clipping Rotating the view reveals the clipped plane the results may be easily seen: parts of isosurface the ears are clipped, area around the neck CLIP Intersects the geometry with a half space. The effect is to remove all the geometry on one side of a user-defined plane. 10

  11. 6/16/2015 Slice Isosurface • Select Filters • Click eye next to Clip1 • Select Common to hide the clip plot • Select Slice • Select Coutour1 SLICE – Intersects the geometry with a plane. The effect is similar to clipping except that all that remains is the geometry where the plane is located. Rotated view Drag arrow point around to front of surface (arrow turns red when selected) 11

  12. 6/16/2015 Clip1 has been made visible along with Slice1 SLICE Intersects the geometry with a plane. The effect is similar to clipping except that all that remains is the geometry where the plane is located. Pipeline Browser headsq.vti Contour1 GETTING YOUR DATA INTO Slice1 Clip1 PARAVIEW (A SAMPLE FILE) 12

Download Presentation
Download Policy: The content available on the website is offered to you 'AS IS' for your personal information and use only. It cannot be commercialized, licensed, or distributed on other websites without prior consent from the author. To download a presentation, simply click this link. If you encounter any difficulties during the download process, it's possible that the publisher has removed the file from their server.

Recommend


More recommend