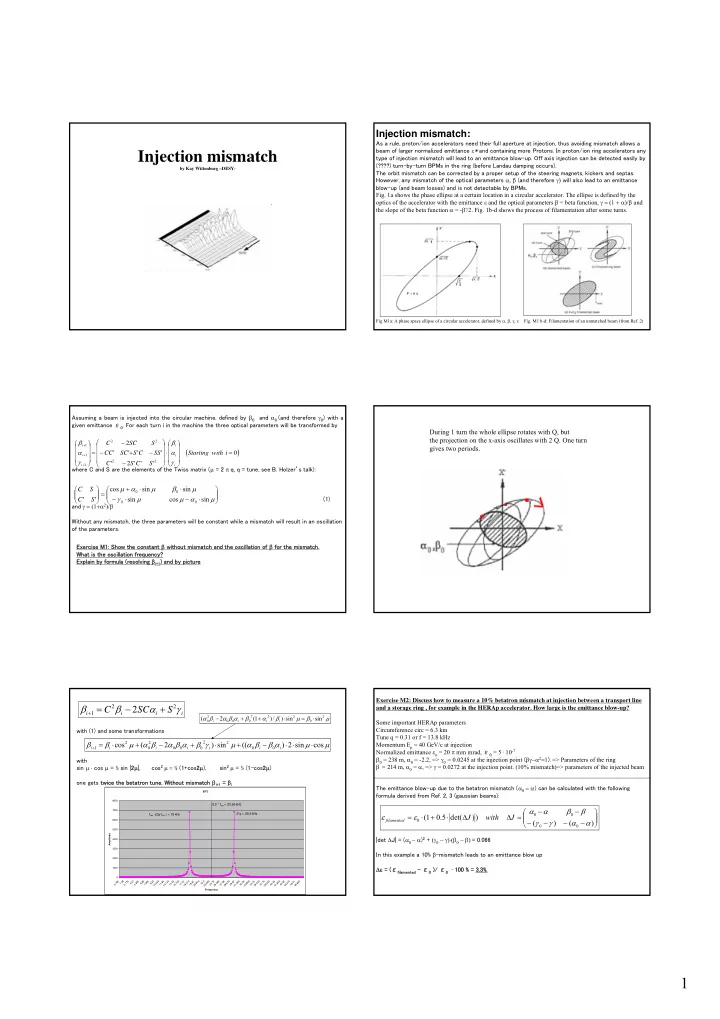
Injection mismatch type of injection mismatch will lead to an - - PDF document

injection mismatch
SMART_READER_LITE
LIVE PREVIEW

Injection mismatch type of injection mismatch will lead to an - - PDF document

Injection mismatch: As a rule, proton/ion accelerators need their full aperture at injection, thus avoiding mismatch allows a beam of larger normalized emittance * and containing more Protons. In proton/ion ring accelerators any Injection


slide-1
SLIDE 1

1

Injection mismatch

by Kay Wittenburg –DESY-

  • Fig. M1 b-d: Filamentation of an unmatched beam (from Ref. 2)

Fig M1a: A phase space ellipse of a circular accelerator, defined by α, β, γ, ε

Injection mismatch:

As a rule, proton/ion accelerators need their full aperture at injection, thus avoiding mismatch allows a beam of larger normalized emittance ε* and containing more Protons. In proton/ion ring accelerators any type of injection mismatch will lead to an emittance blow-up. Off axis injection can be detected easily by (????) turn-by-turn BPMs in the ring (before Landau damping occurs). The orbit mismatch can be corrected by a proper setup of the steering magnets, kickers and septas. However, any mismatch of the optical parameters α, β (and therefore γ) will also lead to an emittance blow-up (and beam losses) and is not detectable by BPMs.

  • Fig. 1a shows the phase ellipse at a certain location in a circular accelerator. The ellipse is defined by the
  • ptics of the accelerator with the emittance ε and the optical parameters β = beta function, γ = (1 + α)/β and

the slope of the beta function α = -β'/2. Fig. 1b-d shows the process of filamentation after some turns. Assuming a beam is injected into the circular machine, defined by β0 and α0 (and therefore γ0) with a given emittance ε0. For each turn i in the machine the three optical parameters will be transformed by where C and S are the elements of the Twiss matrix (μ = 2 π q, q = tune, see B. Holzer’s talk): (1) and γ = (1+α2)/β Without any mismatch, the three parameters will be constant while a mismatch will result in an oscillation

  • f the parameters.

( )

' ' ' 2 ' ' ' ' ' 2

2 2 2 2 1 1 1

= ⎟ ⎟ ⎟ ⎠ ⎞ ⎜ ⎜ ⎜ ⎝ ⎛ ⋅ ⎟ ⎟ ⎟ ⎠ ⎞ ⎜ ⎜ ⎜ ⎝ ⎛ − − + − − = ⎟ ⎟ ⎟ ⎠ ⎞ ⎜ ⎜ ⎜ ⎝ ⎛

+ + +

i with Starting S C S C SS C S SC CC S SC C

i i i i i i

γ α β γ α β ⎟ ⎟ ⎠ ⎞ ⎜ ⎜ ⎝ ⎛ ⋅ − ⋅ − ⋅ ⋅ + = ⎟ ⎟ ⎠ ⎞ ⎜ ⎜ ⎝ ⎛ μ α μ μ γ μ β μ α μ sin cos sin sin sin cos ' ' S C S C Exercise M1: Show the constant β without mismatch and the oscillation of β for the mismatch. What is the oscillation frequency? Explain by formula (resolving βi+1) and by picture During 1 turn the whole ellipse rotates with Q, but the projection on the x-axis oscillates with 2 Q. One turn gives two periods. with (1) and some transformations with sin μ ⋅ cos μ = ½ sin |2μ|, cos2 μ = ½ (1+cos2μ), sin2 μ = ½ (1-cos2μ)

  • ne gets twice the betatron tune. Without mismatch βi+1 = βi

i i i i

S SC C γ α β β

2 2 1

2 + − =

+

μ μ α β β α μ γ β α β α β α μ β β cos sin 2 ) (( sin ) 2 ( cos

2 2 2 2 1

⋅ ⋅ ⋅ − + ⋅ + − + ⋅ =

+ i i i i i i i

  • Fig. M2: β-oscillation amplitudes

FFT 1000 2000 3000 4000 5000 6000 7000 8000 0.185 1.48 2.775 4.07 5.365 6.66 7.955 9.25 10.545 11.84 13.135 14.43 15.725 17.02 18.315 19.61 20.905 22.2 23.495 24.79 26.085 27.38 28.675 29.97 31.265 32.56 33.855 35.15 36.445 37.74 39.035 40.33 41.625 42.92 44.215 45.51 46.805 Frequency Amplitude 0.5 * frev = 23.65 kHz 2*q = 29.2 kHz frev -(2q-frev ) = 18 kHz

μ β μ β α β α β α β α

2 2 2 2 2

sin sin ) / ) 1 ( 2 ( ⋅ = ⋅ + + −

i i i i

Exercise M2: Discuss how to measure a 10% betatron mismatch at injection between a transport line and a storage ring , for example in the HERAp accelerator. How large is the emittance blow-up? Some important HERAp parameters Circumference circ = 6.3 km Tune q = 0.31 or f = 13.8 kHz Momentum Ep = 40 GeV/c at injection Normalized emittance εn = 20 π mm mrad, ε0 = 5 ∙ 10-7 β0 = 238 m, α0 = -2.2, => γ0 = 0.0245 at the injection point (βγ−α2=1). => Parameters of the ring β = 214 m, α0 = α, => γ = 0.0272 at the injection point. (10% mismatch)=> parameters of the injected beam The emittance blow-up due to the betatron mismatch (α0 = α) can be calculated with the following formula derived from Ref. 2, 3 (gaussian beams): |det ΔJ| = (α0 − α)2 + (γ0 − γ)⋅(β0 − β) = 0.066 In this example a 10% β-mismatch leads to an emittance blow up Δε = (εfilamented – ε0 )/ ε0 ∙ 100 % = 3.3%.

⎟ ⎟ ⎠ ⎞ ⎜ ⎜ ⎝ ⎛ − − − − − − = Δ Δ ⋅ + ⋅ = ) ( ) ( ) ) det( 5 . 1 ( α α γ γ β β α α ε ε J with J

filamented

slide-2
SLIDE 2

2

Emittance blow up due to mismatch

2 4 6 8 10 12 14 16

  • 20
  • 15
  • 10
  • 5

5 10 15 20 % of mismatch emittance blow up [%] beta mismatch alpha mismatch

  • Fig. M3: Emittance blow up Δε = (εfilamented - ε )/ ε · 100 % due to mismatch

Exercise M2a: What is the beam size after filamentation? What kind of measurement will you propose to determine the β-mismatch? Which monitor do you propose to use for this measurement? β1=238 m, Normalized emittance εn = 20 π mm mrad, ε0 = 5 · 10-7, εfilamented = 5.162 · 10-7 Δε = (εfilamented – ε0 )/ ε0 · 100 % = 3.3%. The effect is hard to detect for a typical measurement (Take the resolution of the instrument into account) A simple beam width measurement after filamentation at (for example) β1=238 m results in:

mm 91 . 10

1

= ⋅ = β ε σ mm

filamented filamented

08 . 11

1

= ⋅ = β ε σ

A mismatch of the phase space will result in transverse shape

  • scillations, at least for some ten turns, before the filamentation
  • f the beam. =>

Observation of the width-oscillation at one location.

Oscillations of beam width due to mismatched injection

8 8.5 9 9.5 10 10.5 11 11.5 12 12.5 1 2 3 4 5 6 7 8 9 10 11 Number of turns after Injection Width x [mm] "+10% beta-mism." "+10% alpha-mism." "-10% alpha-mism." "no mism." 10% mism. after filamentation

Figure M4: Oscillations of the beam width due to mismatched injection. Note also the small difference

  • f the beam width after filamentation.

A measurement of width oscillations at injection is a very efficient method to detect an optical mismatch that increases the emittance in the circular accelerator. Measurement of the turn-by-turn shape oscillation is possible with a fast (turn by turn) readout of: 1. Thin screen (OTR, Phosphor) 2. SEM grids, 3. IPM, 4. QP-Pickup 5. Synchrotron Radiation (SR) -Monitor (electrons). examples in Refs. 4-8 Exersice M2b: What is the effect of the proposed monitor(s) on the beam?

  • Screen/Grid: Emittance blow-up and losses
  • IPM: Very small, a sufficient signal at each turn needs a pressure bump => emittance blow-up and losses
  • QP-Pickup: None (see Rodri's talk), but very difficult to suppress the dipole mode.
  • SR-Monitior: None, but no light from protons!

Proposed Monitors? Blow-up: A screen/grid or IPM pressure bump will give an additional constant increase of the emittance, but it can easily be separated from the oscillation observation. The protons receive a mean kick at each traverse through a screen resulting in an additional angle θ. where p is the momentum in GeV/c and Z=1 the charge number of the proton, β = v/c the velocity, d the thickness of the foil and lrad the radiation length of the material of the foil. This formula describes the gaussian approximation of the mean scattering angle of the protons after one traverse. The change of the emittance δε for every turn can be calculated by: which adds quadratically to the 1 σ - emittance of the previous turn.

radians in l d l d Z p

rad rad

⎥ ⎦ ⎤ ⎢ ⎣ ⎡ ⎟ ⎟ ⎠ ⎞ ⎜ ⎜ ⎝ ⎛ + ⋅ ⋅ ⋅ =

10

log 9 1 1 014 . β θ

β θ π δε ⋅ ⋅ ⋅ =

2

2

rms

  • D. Möhl, P.J. Bryant,CAS:
  • M. Giovannozzi: CAS 2005:

β θ π δε ⋅ ⋅ =

2

2

rms

β θ π δε ⋅ ⋅ =

2

4

rms x rms rms

β θ ε δ ⋅ ⋅ =

2

2 1

The emittance blow-up is shown in Fig. M5 for a 10 μm thick titanium foil as the source of OTR

  • radiation. In addition a betatron mismatch of 10% is assumed. The figure shows a small growth of the

beam width due to the foil, which does not affect the beam width oscillation. The growth rate is small compared to the oscillation amplitude. The faster growth rate in PETRA is a result of the smaller momentum of the injected protons and therefore a larger scattering angle in the foil. This angle will become much larger in DESY III (p=310 MeV/c, β = 0.3), so that the beam width will become unacceptably large within one turn and the loss rate will increase drastically (in Fig. M5 the line for DESY III extend the border of the figure within 3 turns even with a 1 μm screen).

2 4 6 8 10 12 14 16 18 20 5 10 15 21 26 31 36 41 46 Number of turns Beam width (2σ) [mm] HERA PETRA HERA No mism. DESY III No mism.

  • Fig. M5: Emittance growth due to

a d = 10 μm Titanium foil at injection energy of HERA and PETRA (α = –2 m, β = 40 m, εn = 14 π mm mrad, q = 0.14, p = 7.5 GeV/c) and DESY III (with a foil- thickness of d = 1 μm (!))

slide-3
SLIDE 3

3

SEM-Grids The emittance blow up in DESY III due to a thin foil is much too large. A harp of thin wires produces less emittance blow up. Assuming a harp of 20 μm titanium wires at a separation of 1 mm, the blowup can be calculated like a 0.2 μm foil. Fig. 9 shows the beam oscillation due to a 10% mismatch in DESY III together with the blowup due to these wires. The secondary emission (SEM) current created in the wires can be read

  • ut by fast ADCs turn by turn (315 kHz). Such a readout schema is applied in the PS-Booster at CERN

(Ref.4).

Simulation of the beam width versus turns as measured by SEM grid with and without a +10% beta mismatch in DESY III (α = -1.7 m, β = 14.3 m, εn = 6 π mm mrad, q = 0.28, p = 310 MeV/c)

Losses: The relative proton losses per turn dN/N0 in the foil (thickness d) is given by the nuclear interaction length Lnuc: Lnuc depends on the total nuclear cross section of the nuclear interaction σnuc, the density ρ of the foil and the Avogadro constant NA = 6.0225 ⋅ 1023 mol-1. The nuclear cross section σnuc depends on the proton momentum and on the material of the foil and is shown for different materials in Tab. 1 between a momentum of 0.3 < p < 40 GeV/c:

nuc A nuc nuc

N A L with L d N dN σ ρ ⋅ ⋅ = =

  • Tab. 2: Nuclear total cross sections, interaction length and particle losses

The loss rate is negligible small at the injection energies of proton machines and will not influence the mismatch measurement.

Material Momentum [GeV/c] σnuc [mb] Lnuc [cm] relative loss/turn dN/N0 ⋅ 100 [%] with d = 10 μm A [g/mol] ρ [g/cm³] Carbon 0.3 280 31.5 3 ⋅ 10-3 12.01 7.5 360 24.5 4 ⋅ 10-3 2.26 40 330 22.5 4.4 ⋅ 10-3 Aluminum 0.3 550 30.2 3.3 ⋅ 10-3 26.98 7.5 700 38.4 2.6 ⋅ 10-3 2.70 40 640 35.1 2.8 ⋅ 10-3 Copper 0.3 950 12.4 8.1 ⋅ 10-3 63.546 7.5 1350 17.6 5.7 ⋅ 10-3 8.96 40 1260 16.4 6.1 ⋅ 10-3

Some notes to the readout: The optical readout of screens/IPM is slow. A turn by turn observation needs a 100 kHz (3 km) data collection of the whole image. Line sensors with a larger pixel size (for better sensitivity) may have a readout frequency of 15 MHz/pixel. Assuming 128 pixel will give a maximum readout frequency of 117 kHz for a 1 dim image. A SEM signal as well as the QP-Pickup signal (H. Schmickler’s talk) can be picked up with very high frequencies, even bunch by bunch (100 MHz) and is therefore preferred for smaller ring diameters with a higher revolution frequency and smaller beam momentum to avoid emittance blow-up

That’s the end of the mismatch session

  • Ref. 4: FIRST RESULTS FROM BETATRON MATCHING MONITORS

INSTALLED IN THE CERN PSB AND SPS. By C. Bovet, R. Colchester, C. Dutriat, G. Ferioli, J.J. Gras, R. Jung, P. Knaus, U. Raich, J.M. Vouillot (CERN). CERN-SL-98-037-BI, CERN-SL-98-37-BI, Jun 1998. 4pp. 6th European Particle Accelerator Conference (EPAC 98), Stockholm, Sweden, 22-26 Jun 1998.

The following parameters can be obtained by fitting the data points:

  • The emittance of the injected beam (1.82 π μm). The

advantage of this method, as compared to the standard 3-profile method, lies in the fact that only the beta function has to be taken into account and good statistics are obtained for the beam width due tomultiple measurements on the same beam.

  • Geometric betatron mismatch (~ 50 %) which leads to

an RMS blow-up of 8 %.

  • The contribution of the beam width due to scattering
  • n the SEM-Grid wires is barely visible. The RMS

scattering angle is estimated to 0.04 mrad per turn.

INJECTION MATCHING STUDIES USING TURN BY TURN BEAM PROFILE MEASUREMENTS IN THE CERN PS

  • M. Benedikt, Ch. Carli, Ch. Dutriat, A. Jansson, M. Giovannozzi,
  • M. Martini, U. Raich, CERN, Geneva, Switzerland, DIPAC 2001
slide-4
SLIDE 4

4

A Photo Multiplier Tube (PMT) with 16 anode strips and high speed acquisition electronics [4], were associated to the IPM. The phosphor used was of the P46 type, claimed to have a decay time of 0.3 μs down to 10% and 90 μs down to 1%.

IPM at DESY and CERN

A perfectly matched beam gives an emittance of ε = x2 /β = ε0 (x = beam width, see Fig. 1a). With mismatch, the resulting phase ellipse of Fig. 1d after filamentation gives an emittance of ε = xmax

2/β, which is too large, because only a

small fraction of the particles will fill the whole outer region of the ellipse. However, they will contribute to the measured beam width. Assuming gaussian distributions, the difference (xmax – x) may add two times (because of the two ends of the ellipse) quadratic to x to give the beam width of the fully filamented beam:

β ε

2 2 max

2 ) ( x x x

filamented

+ ⋅ − =

Emittance blow up due to mismatch 2 4 6 8 10 12 14 16 18 20

  • 20
  • 15
  • 10
  • 5

5 10 15 20 % of mismatch emittance blow up [%] beta mism. (this report) beta mism. (Ref. 3, 4) alpha mism. (this report) alpha mism. (Ref. 3, 4)

The emittance blow up, defined by Δε = (εfilamented – ε0 )/ ε0 · 100 % is plotted for the upper approximation (red) and for the correct formula (blue). The agreement is quite good.