INCIDENCE OF Disease foodborne? Criteria: FOODBORNE DISEASES Food - - PDF document

incidence of
SMART_READER_LITE
LIVE PREVIEW

INCIDENCE OF Disease foodborne? Criteria: FOODBORNE DISEASES Food - - PDF document

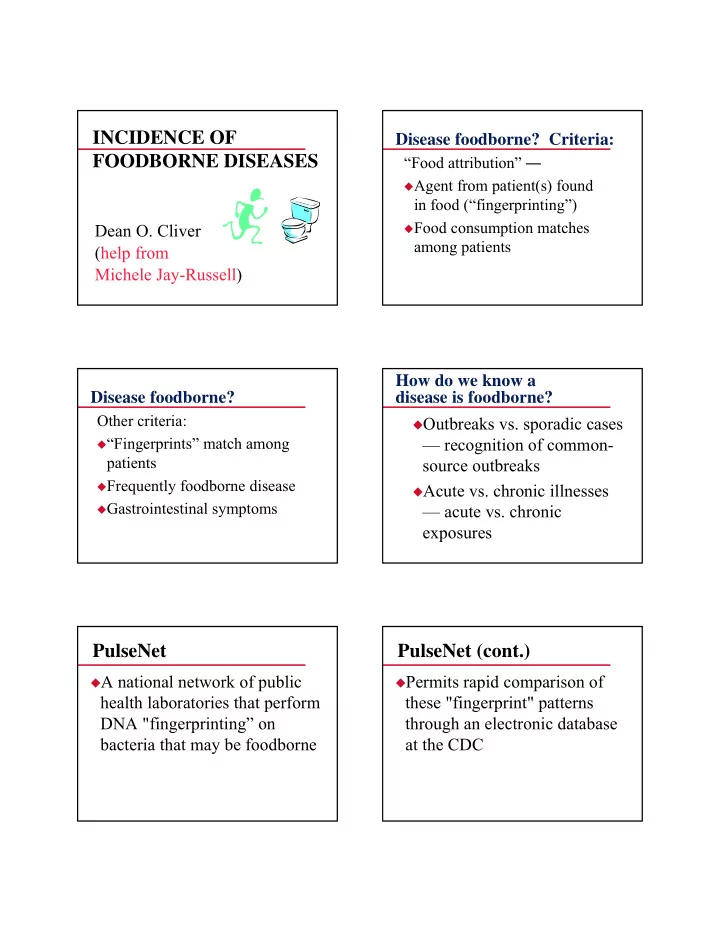
INCIDENCE OF Disease foodborne? Criteria: FOODBORNE DISEASES Food attribution Agent from patient(s) found in food (fingerprinting) Food consumption matches Dean O. Cliver among patients (help from Michele Jay-Russell)


slide-1
SLIDE 1

INCIDENCE OF FOODBORNE DISEASES

Dean O. Cliver (help from Michele Jay-Russell) Disease foodborne? Criteria:

“Food attribution” ―

Agent from patient(s) found

in food (“fingerprinting”)

Food consumption matches

among patients

Disease foodborne?

Other criteria:

“Fingerprints” match among

patients

Frequently foodborne disease Gastrointestinal symptoms

How do we know a disease is foodborne?

Outbreaks vs. sporadic cases

— recognition of common- source outbreaks

Acute vs. chronic illnesses

— acute vs. chronic exposures

PulseNet

A national network of public

health laboratories that perform DNA "fingerprinting” on bacteria that may be foodborne

PulseNet (cont.)

Permits rapid comparison of

these "fingerprint" patterns through an electronic database at the CDC

slide-2
SLIDE 2

PulseNet (cont.)

Allows identification of

concurrent outbreaks across wide geographical areas and aids identification of common source outbreaks

Control Outbreak Control Outbreak Control

PFGE of XbaI-digested genomic DNA of

  • E. coli O157:H7 “outbreak strain” — PulseNet

“At-risk” populations (~1990, CAST)

Category People (× 106)

Pregnant women Neonates Elderly (>65)

5.657 4.002 29.400

“At-risk” populations (~1990, CAST)

Category People (× 106)

In nursing homes Cancer (nonhospitalized) Organ transplant AIDS patients

1.553 2.411 0.110 0.135

How are foodborne illnesses reported?

Reporting channels Compilation Reporting

Reporting channels— from physician or ?

Levels of government; priorities Paper vs electronic FoodNet — data from diagnostic

laboratories

Outbreak suspected, investigated?

slide-3
SLIDE 3

Compilation

Structure of

information gathering

Structure of

information recording

Reporting

Choice of "medium“ Timing

C

  • r

r e s p

  • n

d i n g a u t h

  • r

: M i c h a e l L y n c h , M D , D i C

  • r

r e s p

  • n

d i n g a u t h

  • r

: M i c h a e l L y n c h , M D , D i

U.S. statistics on foodborne disease

Outbreaks only Reported incidence:

  • utbreaks, cases, deaths

"Causes": etiology,

contributing factors

U.S. statistics on foodborne disease

Seasonality, place food was

eaten, vehicles (identity vs. "ethnicity")

Undetermined etiology —

FoodNet

Estimates from CDC in

Emerging Infectious Diseases

Foodborne diseases active surveillance network

Campylobacter, E. coli O157,

STEC non-O157, Listeria, Salmonella, Shigella, Vibrio, Yersinia, Cryptosporidium, Cyclospora, HUS

All clinical labs contacted at least

monthly

slide-4
SLIDE 4

“FoodNet”

Collaborative effort between state

health departments, USDA, FDA, CDC

Principal foodborne diseases

component of CDC’s Emerging Infections Program (EIP)

Established in 1995 in four sites Currently 10 EIP sites with 41 million

persons under surveillance

CA EIP site includes San Francisco, Alameda, and Contra Costa counties

Emerging Infections Program sites (FoodNet) FOODBORNE DISEASE OUTBREAKS, U.S., 1998–2002

Outbreaks Cases Deaths No. % No. % No. Bacterial 1184 17.8 37887 29.5 70 Chemical 221 3.3 1140 0.9 Parasitic 23 0.3 630 0.5 Viral 709 10.7 28274 22.0

Multiple

30 0.5 1060 0.8

Confirmed 2167 32.6 68991 53.7

76

FOODBORNE DISEASE OUTBREAKS, U.S., 1998–2002

Outbreaks Cases Deaths No. % No. % No. Confirmed etiology 2167 32.6 68991 53.7 76 Undetermined etiology 4480 67.4 59389 46.2 12 Total (5 yr) 6647 100 128380 100 88

BACTERIAL FOODBORNE DISEASE, REPORTED VS EST.

Species Reported, 1998–2002 Estimated, annual Campylobacter 1,440 1,963,141

  • Clos. perfringens

6,724 248,520 Escherichia coli 4,864 173,107

  • L. monocytogenes

256 2,493 Salmonella 16,821 1,341,873

FoodNet data

Organism 1996– 1998 2005 Campylobacter(/105) 21.7 12.7

  • E. coli O157 (/105)

2.3 1.1 Listeria (/106) 4.9 3.0 Salmonella (/105) 13.5 14.6 Shigella (/105) 7.7 4.7

slide-5
SLIDE 5

ANNUAL (FOODBORNE?) CASES, U.S., BY SOURCE

43,800 1,340,000 16,821 Salmonella 38,100 1,960,000 1,440 Campylobacter FoodNet (2005, 3×10⁸) Estimated (Mead et al., 1999) Passive (1998– 2002) Agent

PARASITIC & VIRAL F-BN DISEASE, REPORTED VS EST.

Species Reported, 1998–2002 Estimated, annual Giardia 119 200,000 Toxoplasma 112,500 Trichinella 33 52 Hepatitis A 981 4,170 Noroviruses 27,171 9,200,000

FoodNet data (annual)

Organism (all /106 people) 1996– 1998 2005 Cryptosporidium 26.8 29.5 Cyclospora 1.6 1.5 Vibrio 2.4 2.7 Yersinia 8.9 3.6

California Agriculture

Leads US: ~88,000 farms & ranches; related economic activity = $100 billion Largest provider of milk & dairy products ($47.4 billion) Leads the nation in agricultural exports ($6.5 billion/yr) Large, diverse population

Foodborne illness in California

9 million illnesses

(viral>bacteria>parasitic)

39,000 hospitalizations

(bacterial>viral>parasitic)

600 deaths

(bacterial>parasitic>viral)

20 40 60 80 100 120 140 160 180 Number of outbreaks 1990 1991 1992 1993 1994 1995 1996 1997 1998 1999 2000 2001 Year Unknown Suspected Confirmed

Foodborne outbreaks in California 1990–2001

slide-6
SLIDE 6

Confirmed etiologic agents, CA

43 (100) 39 (100) 45 (100) 37 (100) Total 18 (43) 12 (31) 15 (33) 1 (3) Viral 4 (10) 4 (10) 2 (4) 0 (0) Chemical 0 (0) 3 (8) 1 (2) 1 (3) Parasitic 20 (48) 21 (54) 27 (60) 35 (95) Bacterial 2002 # (%) 2001 # (%) 2000 # (%) 1999 # (%) Etiology

Foodborne outbreaks, California

71 (50) 45 (32) 17% 141 (3716) 2000 103 (58) 39 (22) 25% 177 (2806) 2001 143 (69) 40 (20) 17% 207 (3355) 2002 55 (46) 37 (31) 20% 121 (3325) 1999 Suspected # (%) Confirmed # (%) Increase Outbreaks (Cases) Year

Specific agents in foodborne outbreaks, CA

5 (13) 5 (13) 1 (3) 2 (5)

  • E. coli O157

7 (18) 1 (3) 5 (13) 12 (31) 2001 # (%) 3 (9) 6 (17) 13 (29) 14 (31) 2000 # (%) 2 (5) 5 (14) Shigella 1 (3) 14 (38) Salmonella Enteritidis 8 (20) 9 (24) Salmonella (non SE) 18 (45) 1 (3) Norovirus 2002 # (%) 1999 # (%) Etiology

Food vehicle by year of outbreak, CA

11 (11) 12 (21) Other 16 (17) 7 (13) Multiple 7 (7) 4 (7) Seafood 17 (18) 12 (21) Eggs 2 (2) 3 (5) Dairy 14 (15) 17 (30) Meats 29 (30) 1 (2) Produce 1996–2000 1991–1995 Vehicle

Includes only outbreaks with a confirmed etiologic agent.

What about foodborne disease in

  • ther countries? (e.g., Europe)

Some have no reporting

mechanism

Salmonella is almost

everywhere—may be presumed foodborne

Campylobacter often not sought

Other countries?

Viruses rarely reported (EU) —

hepatitis A presumed foodborne in Germany

“Undetermined etiology” vs.

“other-and-unknown” and “infectious enteritis”

UK’s special problem―vCJD

slide-7
SLIDE 7

CJD in the UK

13 10 5 5 65 57 2005 2006 6 9 51 2004 11 18 76 2003 5 17 72 2002 9 20 58 2001 Other vCJD Sporadic Year

Other countries?

Some countries seem not to consider

foodborne disease from food prepared and eaten at home, whereas

  • thers take this very seriously.

Canada similar to U.S., except that

foodborne virus disease is rare, and acute illness is sometimes attributed to yeasts and molds.

Other countries?

European Union now has a

program; Australia and New Zealand seem to be

  • n the way

Pan American Health

Organization—Latin America & Caribbean

What might we aspire to?

More timely reporting More complete reporting Measures of severity and

economic impact –Monetary costs –“Human” costs

FoodNet

Prognosis for foodborne disease reporting

From physicians to national

health services, incentives to report are lacking

FoodNet Undetected problems don't

require solutions (disincentives)

Who speaks for the public?

Summary

Information on incidence of

foodborne disease = "educated" (?) guesses

This ignorance has led to

misapplication of limited resources for food safety

slide-8
SLIDE 8

Summary

Ignorance persists because of

political expediency

The "public" is unlikely to

make things better

FoodNet may make a

difference