
SLIDE 1
Fire and Gas Mapping. Optimized.
Developed by Insight Numerics www.insightnumerics.com
Slide 1
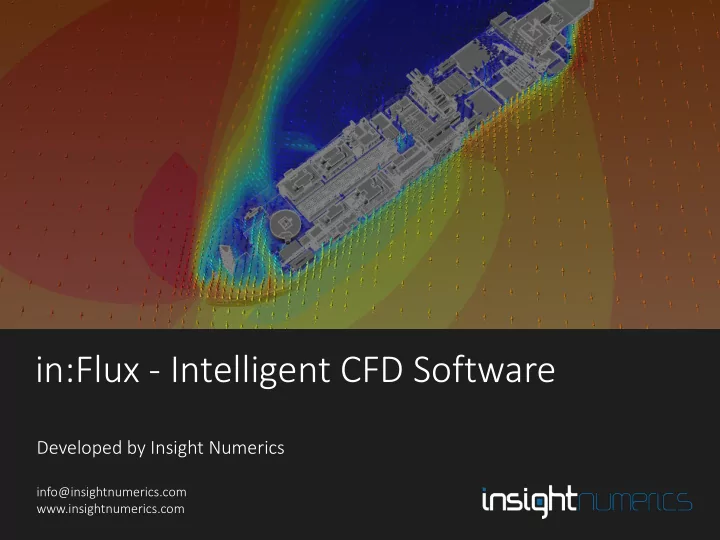
in:Flux - Intelligent CFD Software
Developed by Insight Numerics
info@insightnumerics.com www.insightnumerics.com
in:Flux - Intelligent CFD Software Developed by Insight Numerics - - PowerPoint PPT Presentation
in:Flux - Intelligent CFD Software Developed by Insight Numerics Slide 1 info@insightnumerics.com Developed by Insight Numerics www.insightnumerics.com Fire and Gas Mapping. Optimized. www.insightnumerics.com Introduction to in:Flux in:Flux
Fire and Gas Mapping. Optimized.
Developed by Insight Numerics www.insightnumerics.com
Slide 1
Developed by Insight Numerics
info@insightnumerics.com www.insightnumerics.com
Developed by Insight Numerics www.insightnumerics.com
Slide 2
Developed by Insight Numerics www.insightnumerics.com
Slide 3
Developed by Insight Numerics www.insightnumerics.com
Slide 4
SE Asia PETRONAS - FLNG 2 ThaiOil – Clean Fuels Project Vestigo - MaMPU FPSO Pertamina – PPP JX Nippon – Helang Project HESS – Anggerik WHP Platform Linde/Petronas – Marlin BOG LNG Africa Shell – SSAGS Total – CLOV FPSO Chevron – Cabinda Platform Eni – Coral South Development East Asia COSCO Shipyard – FPSO HHI – multiple projects Seoul National University Asia BP – South Caucasus Pipeline Expansion Chevron/TCO – Kazaskhstan Project GAZPROM – Badra-Zubaida Pipeline The Americas TechInt – Pluspetrol Plant ALPEK – FGRU Indelpro SOFEC – several projects Petrobras/MODEC – FPSO Cidade de Caraguatatuba Petrobras/MODEC – FPSO Carioca MV30 Petrobras – FPSO Cidade de Marica Petrobras – FPSO Cidade de Ilhabela Europe Equinor (Statoil) – Johan Sverdrup Platform Maersk – Culzean Platform & FSO Ineos – Grangemouth Apache – multiple projects Technip/JGC – Coral South Development Project BP – West Sole Charlie Platform Perenco – several projects Novo Nordisk – API Manufacturing Maersk (Total) – Tyra Platform GCC Countries KNPC – Clean Fuels Project KNPC – Al-Zour Refinery KOC – multiple projects ADNOC – Abu Dhabi Airport Exp. ADNOC – UZ750 GASCO – Habshan Plant GASCO – ICAD Gas Treatment GASCO – Taweelah TGC Project Dubai Petroleum – Fateh Complex BP – Khazzan Project ORPIC – Liwa Plastics Complex ORPIC – Mina Al Faha Refinery Takreer – Ruwais Refinery DUQM – Package 3 EgyptianLNG – reassessment project
Developed by Insight Numerics www.insightnumerics.com
Slide 5
Developed by Insight Numerics www.insightnumerics.com
Slide 6
Developed by Insight Numerics www.insightnumerics.com
Slide 7
1. 3D CAD file 2. Knowledge of process conditions (pressure, temperature, inventory) and required leak locations. 3. Knowledge of the site atmospheric conditions, such as a wind direction and wind speed
Developed by Insight Numerics www.insightnumerics.com
Slide 8
Via the DGN file import, in:Flux can load CAD from PDMS and SmartPlant3D. Navisworks (NWD) files can be imported via DWF files and AutoCAD DWG, DXF and other standard CAD formats (STEP, IGES, OBJ and STL) are also accepted.
Above Screenshot of in:Flux showing a simple CAD file of an example facility. Right Other examples of CAD models loaded into in:Flux. There is no limitation to size or complexity of the CAD model which can be loaded.
Developed by Insight Numerics www.insightnumerics.com
Slide 9
Once CAD has been loaded into the software, ventilation simulations can be defined simply by choosing a wind direction and wind speed.
Developed by Insight Numerics www.insightnumerics.com
Slide 10
The mesh initially refines around the geometry, and includes boundary-layer grading from the ground to capture the high gradients.
Above and Upper Right Top and isometric views of the mesh around the CAD model. Right Side view of the auto-generated mesh around a CAD model. Showing refinement at the base to accurately calculate the boundary layer.
Developed by Insight Numerics www.insightnumerics.com
Slide 11
The simulation will automatically start – there is no need for any additional
Developed by Insight Numerics www.insightnumerics.com
Slide 12
regions of high gradient. Below are screenshots of before the simulation starts and after it has finished.
Developed by Insight Numerics www.insightnumerics.com
Slide 14
When the simulation is complete, a variety of post-processing options are available, including contours:
Developed by Insight Numerics www.insightnumerics.com
Slide 15
The vector field shows local flow regions around the equipment and are colored corresponding to the magnitude value.
Developed by Insight Numerics www.insightnumerics.com
Slide 16
Streamlines are useful to show circulation regions and flow through the domain:
Developed by Insight Numerics www.insightnumerics.com
Slide 17
entering an upstream pressure value, temperature and composition.
can be set.
database.
Developed by Insight Numerics www.insightnumerics.com
Slide 18
A dispersion simulation is defined simply as a combination of a leak source and a wind simulation. No further setup is required.
Developed by Insight Numerics www.insightnumerics.com
Slide 19
For dispersion simulations, the mesh adapts around regions of high concentration
Above Zoomed in view of mesh at leak location. The mesh will refine itself as the calculation progresses Upper Right and Right Top view of the auto-generated mesh at start of dispersion simulation (upper right) and after the simulation has completed (right).
Developed by Insight Numerics www.insightnumerics.com
Slide 21
Isosurfaces are useful to show the dispersed gas clouds. These can be set up as concentrations of %volume, ppm, %LEL and %UEL. The below image shows a 100% LFL cloud in red and a 10%LFL cloud in transparent yellow.
Developed by Insight Numerics www.insightnumerics.com
Slide 22
Monitor points provide spot measurements of concentrations, while monitor regions can be used to calculate cloud volumes. All data is exportable to Excel. There is no limit to the number of monitors in an in:Flux project.
Developed by Insight Numerics www.insightnumerics.com
Slide 23
The example simulation in this presentation has shown one ventilation and one
scheduler, shown below, without the need of scripting.
Developed by Insight Numerics www.insightnumerics.com
Slide 24
without the need to import the original CAD file
imported from Detect3D to in:Flux as monitor point and monitor lines to received %LFL and LEL.m data
Detect3D – CAD model, point and open path gas detectors positioned in project in:Flux – CAD model imported from Detect3D as well as the gas
lines, shown in yellow above.
Developed by Insight Numerics www.insightnumerics.com
Slide 26
Above - Experimental rig for LNG vapor release (18” vertical plume shown), Ref [1]. Top Right - Plume paths for various models tested in Ref [1], horizontal 6” diameter release. Bottom Right – Results from . Plume path for in:Flux, horizontal 6” diameter release. Ref [1] - Quillatre, P. Relevance of the current modeling methods for the prediction of LNG vapor dispersion and development to be carried on. IChemE Symposium Series No. 162, Hazards 27 Conference, 2017.
Developed by Insight Numerics www.insightnumerics.com
Slide 27
Developed by Insight Numerics www.insightnumerics.com
Slide 28
Developed by Insight Numerics www.insightnumerics.com
Slide 29