
SLIDE 1
1
in Central America Acquisition of Telefnica Assets in Panama, Costa - - PowerPoint PPT Presentation
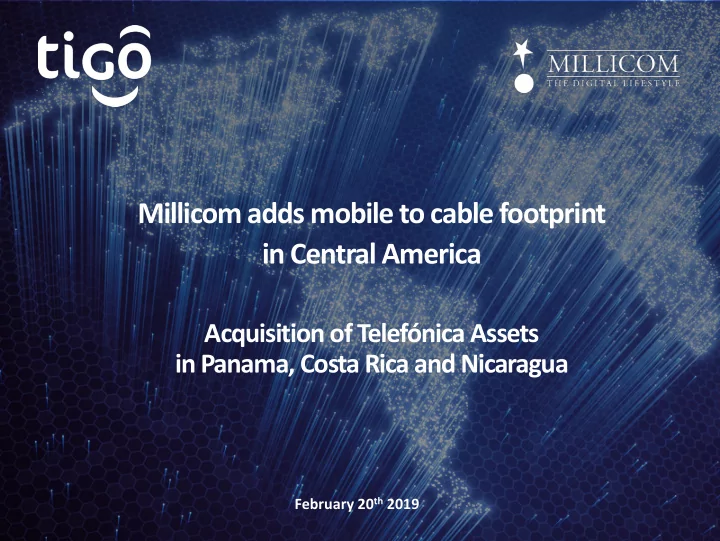
Millicom adds mobile to cable footprint in Central America Acquisition of Telefnica Assets in Panama, Costa Rica and Nicaragua February 20 th 2019 1 Safe Harbor Cautionary Language Concerning Forward-Looking Statements Statements included
1
2
Cautionary Language Concerning Forward-Looking Statements Statements included herein that are not historical facts, including without limitation statements concerning future strategy, plans, objectives, expectations and intentions, projected financial results, liquidity, growth and prospects, are forward-looking statements. Such forward-looking statements involve a number of risks and uncertainties and are subject to change at any time. This includes, but is not limited to, Millicom’s expectation and ability to pay semi-annual cash dividends on its common stock in the future, subject to the determination by the Board of Directors, and based on an evaluation of company earnings, financial condition and requirements, business conditions, capital allocation determinations and other factors, risks and uncertainties. In the event such risks or uncertainties materialize, Millicom’s results could be materially adversely affected. The risks and uncertainties include, but are not limited to, the following:
face of competition from existing and new market entrants as well as industry consolidation;
licenses, the level of tariffs, tax matters, the terms of interconnection, customer access and international settlement arrangements;
deployment of new systems and applications to support new initiatives;
effective manner and achieve the expected benefits of such transactions;
savings and realize productivity improvements;
cost of upgrading existing infrastructure;
and
A further list and description of risks, uncertainties and other matters can be found in Millicom’s Registration Statement on Form 20-F, including those risks outlined in “Item 3. Key Information—D. Risk Factors,” and in Millicom’s subsequent U.S. Securities and Exchange Commission filings, all of which are available at www.sec.gov. All forward-looking statements attributable to us or any person acting on our behalf are expressly qualified in their entirety by this cautionary
to the extent otherwise required by applicable law, we do not undertake any obligation to update or revise forward-looking statements, whether as a result of new information, future events or otherwise.
3
This presentation contains financial measures for Millicom not prepared in accordance with IFRS. These measures are referred to as “non-IFRS” measures and include: non-IFRS service revenue, non-IFRS EBITDA, and non-IFRS Capex, among others defined below. Annual growth rates for these non-IFRS measures are often expressed in organic constant currency terms to exclude the effect of changes in foreign exchange rates, the adoption of new accounting standards such as IFRS 15, and are pro forma for material changes in perimeter due to acquisitions and divestitures. The non-IFRS financial measures are presented in this press release as Millicom’s management believes they provide investors with additional information for the analysis of Millicom’s results of operations, particularly in evaluating performance from one period to another. Millicom’s management uses non-IFRS financial measures to make operating decisions, as they facilitate additional internal comparisons of Millicom’s performance to historical results and to competitors' results, and provides them to investors as a supplement to Millicom’s reported results to provide additional insight into Millicom’s operating performance. Millicom’s Remuneration Committee uses certain non-IFRS measures when assessing the performance and compensation of employees, including Millicom’s executive directors. The non-IFRS financial measures used by Millicom may be calculated differently from, and therefore may not be comparable to, similarly titled measures used by other companies - refer to the section “Non-IFRS Financial Measure Descriptions” for additional information. In addition, these non-IFRS measures should not be considered in isolation as a substitute for, or as superior to, financial measures calculated in accordance with IFRS, and Millicom’s financial results calculated in accordance with IFRS and reconciliations to those financial statements should be carefully evaluated. Non-IFRS Financial Measure Descriptions Service revenue is revenue related to the provision of ongoing services such as monthly subscription fees, airtime and data usage fees, interconnection fees, roaming fees, mobile finance service commissions and fees from other telecommunications services such as data services, short message services and other value-added services excluding telephone and equipment sales. EBITDA is defined as operating profit excluding impairment losses, depreciation and amortization, and gains/losses on the disposal of fixed assets. Underlying measures, such as Service revenue, EBITDA and Net debt, include Guatemala and Honduras as if full consolidated. Proportionate EBITDA is the sum of the EBITDA in every country where Millicom operates, including its Guatemala and Honduras joint ventures, pro rata for Millicom’s ownership stake in each country, less unallocated corporate costs and inter-company eliminations. Organic growth represents year-on year-growth excluding the impact of changes in FX rates, perimeter, and accounting. Net debt is Gross debt (including finance leases) less cash and pledged and term deposits. Proportionate net debt is the sum of the net debt in every country where Millicom operates, including its Guatemala and Honduras joint ventures, pro rata for Millicom’s ownership stake in each country. Net debt to EBITDA is the ratio of net debt over LTM (last twelve month) EBITDA. Proportionate net debt to EBITDA is the ratio of proportionate net debt over LTM proportionate EBITDA. Capex is balance sheet capital expenditure excluding spectrum and license costs and finance lease capitalizations from tower sale and leaseback transactions. Cash Capex represents the cash spent in relation to capital expenditure, excluding spectrum and licenses costs and finance lease capitalizations from tower sale and leaseback transactions. Operating Cash Flow (OCF) is EBITDA less Capex. Operating Free Cash Flow is OCF less changes in working capital and other non-cash items and taxes paid. Equity Free Cash Flow is Operating Free Cash Flow less finance charges paid (net), less advances for dividends to non-controlling interests, plus dividends received from joint ventures. Return on Invested Capital (ROIC) is used to assess the Group’s efficiency at allocating the capital under its control to and is defined as Operating Profit After Tax, including Guatemala and Honduras as if fully consolidated, divided by the average invested Capital during the period. Operating Profit After Tax displays the profit generated from the operations of the company after statutory taxes. Average Invested Capital is the capital invested in the company operation throughout the year and is calculated with the average of opening and closing balances of the total assets minus current liabilities (excluding debt, joint ventures, accrued interests, deferred and current tax, cash as well as investments and non-controlling interests), minus assets and liabilities held for sale. A reconciliation of the non-IFRS metrics to the nearest equivalent IFRS metrics, or otherwise a description of the calculation and presentation of such non-IFRS metrics, may be found in Millicom’s quarterly earnings releases found on the Millicom website at https://www.millicom.com/investors/reporting-centre/
4
Financial Data for Telefonica businesses The financial data for the Telefonica businesses that are included in this presentation are derived from unaudited standalone financial statements prepared by Telefonica for each of the Panama, Costa Rica and Nicaragua businesses. Such financial statements have not been audited and Millicom has not independently verified the financial statements. All metrics for the Telefonica businesses that are presented on a combined basis and are indicative only, as such combined data are based on a simple combination of the aforementioned standalone financial statements, with limited adjustments, and are not derived from combined financial statements prepared in accordance with IFRS. Finally, any metrics for the Telefonica businesses that are presented as non-IFRS metrics may be calculated and presented on a different basis to similarly titled non-IFRS metrics presented by Millicom. Illustrative Pro Forma and Estimated Synergy Financial Data for Millicom Certain metrics that are included in this presentation are presented on an illustrative ‘pro forma’ or ‘combined’ basis to give effect to the acquisition by Millicom of the Telefonica businesses. These metrics are not derived from pro forma financial statements prepared in accordance with any accounting or regulatory framework. These metrics are estimates and have been prepared for illustrative purposes only. Readers should treat these metrics as indicative only and not place undue reliance on them. For example, Telefonica and Millicom use different accounting policies and the illustrative pro forma metrics presented here do not adjust for such differences. Moreover, there is no guarantee that, if controlled by Millicom during the periods presented, these businesses would have generated such results. Equally, the illustrative pro forma metrics presented here should not be taken as guidance for future performance. This presentation also contains Millicom’s estimates of certain synergies, relating to both expenses and revenues, that Millicom expects to achieve following completion of the acquisitions. There can be no guarantee that these estimated synergies will be achieved. As such, undue reliance should not be placed on these estimates, which are forward looking statements and subject to Millicom’s forward looking statements notice. See “Cautionary Language Concerning Forward-Looking Statements”.
5
Accelerates fixed-mobile convergence strategy, complementing our existing fixed portfolio with leading mobile assets Reinforces our leadership position in Central America, further diversifying our geographical presence and financial profile Unlocks significant value creation, with up to $500 millionNPV of estimated synergies
Reshapes industry landscape, in our Central America region
5
6
Att ttractiv ive va valu luation to
create si signif ific icant sha sharehold lder valu value
Acq cquisit ition of
a hig highly attr attractive bu busin iness
St Strong st strategic ic rat ratio ionale for for grea greater sca scale le an and div diversification
annual run-rate opex and capex expected synergies of $35-50 million
Hig Highly syn synergetic ic in in-market con consoli lidation
1 Adjusted EBITDA refers to combined Adjusted EBITDA of the standalone businesses pre-synergies, excluding management fees and other non-recurring items. Adjusted EBITDA is a non-IFRS
7
Panama 31% Nicaragua 33% Costa Rica 36% Panama 37% Nicaragua 38% Costa Rica 25%
A well-balanced portfolio Leading market positions 1
History of growth, margin expansion, and cash flow generation
624 649 688 709 2015A 2016A 2017A 2018A
Combined Adjusted EBITDA2 ($243 million) Combined OCF3 ($164 million)
Mobile subs 2018: 4.7m Mobile mkt share: 53% Mobile ranking: #1 of 2 Nicaragua Mobile subs 2018: 2.4m Mobile mkt share: 25% Mobile ranking: #2 of 3 Costa Rica Panama Mobile subs 2018: 1.6m Mobile mkt share: 34% Mobile ranking: #1 of 4 Combined Revenue
2015-2018A ($m)
178 188 225 243 2015A 2016A 2017A 2018A
Combined Adjusted EBITDA2 and Margin
28.5% 29.0% 32.7% 34.2% 68 97 142 164 2015A 2016A 2017A 2018A
Combined OCF and Cash Conversion 3,4
38.0% 51.4% 63.1% 67.4% Margin (%) CF Conversion (%)
Combined Revenue ($709 million)
1 Market share estimate based on 2017A (GlobalData Jun-18). 2 Adjusted EBITDA refers to EBITDA of the standalone businesses pre-synergies, excluding management fees and other non-recurring items. 3 OCF defined as Adjusted EBITDA less Capex. 4 Cash Conversion equal to OCF divided by Adjusted EBITDA. Adjusted EBITDA and OCF are non-IFRS measures.
EBITDA Revenue OCF
Breakdown by Country (2018A)
Around 50% of revenue is USD-denominated Panama 37% Nicaragua 44% Costa Rica 19%
1
8
Strengthening our leadership position in Central America with No. 1 or No.2 positions in every market
Co Costa Ri Rica 2 El El Salv Salvador
Gu Guatemala la Ni Nicaragu gua 2 Pan anama
Mobile Broadband PayTV Fixed Voice Mobile Broadband PayTV Fixed Voice Mobile Broadband PayTV Fixed Voice Mobile Broadband PayTV Fixed Voice Mobile Broadband PayTV Fixed Voice
1 1
1 Pro-forma for TEF CAM acquisition. 2 Other players in Costa Rica and Nicaragua
TEF CAM acquisition
2
9
Bolivia 9% Colombia 19% El Salvador 5% Guatemala 26% Honduras 10% Paraguay 13% Panama 10% Other 8% Bolivia 9% Colombia 25% El Salvador 6% Guatemala 21% Honduras 9% Paraguay 10% Panama 10% Other 10%
Balance between the different Latam markets improves
Bolivia 11% Colombia 30% El Salvador 8% Guatemala 25% Honduras 11% Paraguay 12% Other 3% Latam (2018A)
1 Illustrative Pro forma for both Cable Onda and Telefonica CAM. ‘Other’ includes Nicaragua and Costa Rica. 2 Adjusted EBITDA breakdown excludes segment corporate costs. Adjusted EBITDA is a non-IFRS measure. Please refer to slide 3 of this presentation for definitions of non-IFRS measures for Millicom.
Reconciliations of non-IFRS measures for Millicom to their nearest IFRS equivalent are available at www.millicom.com.
3 Millicom ownership of market with minority interests: Colombia 50%, Guatemala 55%, Honduras 66.7%, Panama 80%
Revenue Adjusted EBITDA2
Latam (2018A)
Illustrative Pro forma Adjusted EBITDA2
Latam (2018A) 1 Latam (2018A) 1
Illustrative Pro forma Revenue
Bolivia 11% Colombia 22% El Salvador 6% Guatemala 31% Honduras 12% Paraguay 15% Other 3% 13% based on
2
20% based on
10
Colombia Bolivia Paraguay NPS Non Convergent NPS Convergent Prepaid to Postpaid New Postpaid Home ARPA before Convergence Home ARPA after Convergence
… which so far resulted in a consistent NPS and ARPA1 improvement
(USD)
+18% +27% +15% +18% +45%
1 Average Revenue per Account
The transaction provides the opportunity to accelerate Millicom’s FMC strategy…
Panama
Costa Rica
Nicaragua
2
11
NPV of expected synergies of approximately $500 million, including $290 million of opex and capex synergies
c.230
c.70
Opex Capex Revenue Integration Costs Total Net Synergies
$m
Annual Run rate 2 Network and IT benefits –
Optimisation of backbone and operations, software and
Sales, distribution and branding –
Consolidation of B2C department, media/comm. spending, de-duplication of retail footprint and R&D spending
Optimization of SG&A to reduce duplication of functions $30-40 million Opex Synergies Integration Costs Approximately $100 million pre-tax integration cost incurred over 2 years
3
Increased Millicom mobile scale Leverage Millicom in-country fibre backhaul capabilities Consolidation and rationalization of IT spend $5-10 million Capex Synergies Cross-sell of mobile offer to B2B and B2C customers –
Coupled with increased shift from prepaid to postpaid
Cross-sell of existing Home offers to mobile customers Lower churn and more competitive bundled offerings $35-45 million Revenue Synergies
Net Present Value 1
1 For disclosure purposes, net present value of the post-tax synergies rounded to the nearest ten million. Sum may not reconcile due to rounding1 2 Estimated full synergies run rate starting for the 4th full year post closing.
Estimated synergy range
12
Attractive OCF multiple of 10x pre synergies and 8.3x post opex and capex synergies
1 Adjusted EBITDA refers to Adjusted EBITDA of the standalone business pre-synergies, excluding management fees and other non-recurring items. Adjusted EBITDA is a non-IFRS measures.
4
Meets our criteria for inorganic growth opportunities
13
Revenue
Latam, 2018A ($m)
Adjusted EBITDA
Latam, 2018A ($m)
OCF
Latam, 2018A ($m) Notes: Telefonica CAM Adjusted EBITDA is standalone, pre-synergies, and is adjusted to exclude management fees and other one-time items. OCF defined as Adjusted EBITDA less Capex Latin America segment Revenue, Adjusted EBITDA and OCF measures are non-IFRS measures and include Guatemala and Honduras as if fully consolidated. Please refer to slide 3 of this presentation for definitions of non-IFRS measures for Millicom. Reconciliations of non-IFRS measures for Millicom to their nearest IFRS equivalent are available at www.millicom.com.
Telefonica CAM would have added 12-15% to Millicom Latam segment financials in 2018
5,485 709 6,194 Millicom Telefonica CAM Combined 2,077 243 2,320 Millicom Telefonica CAM Combined 1,124 164 1,287 Millicom Telefonica CAM Combined
12.9% 11.7% 14.6%
14
Pro Forma Prop. Net Debt / Adjusted EBITDA2
As of Dec-2018
2.5x 3.0x Millicom Combined
1 Underlying net debt, Adjusted EBITDA and Underlying net debt to Adjusted EBITDA are non-IFRS measures. Please refer to slide 3 of this presentation for definitions of non-IFRS measures for
based on last twelve-month (LTM) Underlying EBITDA of $1,666m, incl. $136m pro forma Adjusted EBITDA for Cable Onda in Panama and $224m of Adjusted EBITDA for Telefonica CAM.
Maintaining a strong and disciplined financial position
0.5x 2018A ($m)
2,077 243 2,320 Millicom Telefonica CAM Combined
Latam segment Adjusted EBITDA
As of Dec-2018
5,116 1,650 6,766 Millicom Additional Debt Combined
Millicom Underlying Net Debt 1
11.7%
15
15
16
17
1,529 1,552 1,524 1,612 2015A 2016A 2017A 2018A B2C + B2B Mobile Subs EoP ('000)
196 201 214 223
2015A 2016A 2017A 2018A
73 71 85 90
2015A 2016A 2017A 2018A 37.3% 39.5%
Revenue Adjusted EBITDA and Margin3
35.3% 40.5% $m
1.5M
1K
19K
Mobile BB PayTV Fixed Voice
Customers (2017A)
Combined
2015-18A
Mobile ARPU ($/month)1
Coverage Map Spectrum Distribution
87% 74% 3G 4G 20 25 20 65 Panama 1,900 MHz 850 MHZ 700 MHz
Shift in customer mix driving ARPU uplift Complementary business propositions Strong network coverage and valuable spectrum assets Solid financial performance
$7.5 $8.5 $8.0 $7.8 5K
#1 #1 #1 #2 Market Position 2
1 Based on average B2C and B2B Mobile subscribers for each year. 2 Based on GlobalData as of June-18. 3 Adjusted EBITDA refers to the Adjusted EBITDA of the standalone business pre-synergies,
excluding management fees, and other non-recurring items. Adjusted EBITDA is a non-IFRS measure. Population coverage 2017A: MHz, paired Spectrum share: 28%
18
1,654 1,996 2,134 2,381 2015A 2016A 2017A 2018A B2C + B2B Mobile Subs EoP ('000)
Coverage Map Spectrum Distribution
93% 85%
176 198 231 253
2015A 2016A 2017A 2018A
11 26 45 60
2015A 2016A 2017A 2018A
Revenue Adjusted EBITDA and Margin3
2.1M 7K 20K 22K
Mobile BB PayTV Fixed Voice
$m 2015-18A
$7.3 $6.6 $7.1 $6.9
3G 4G 10 50 40 100 Costa Rica 1,900 / 2,100 MHz 1,800 MHZ 850 MHZ
Significant growth in customer base Complementary business propositions Nation-wide network coverage Commercial expansion driving operational leverage
Combined #2 #2 #2 #1
Population coverage 2017A: MHz, paired Spectrum share: 28%
Mobile ARPU ($/month)1
Market Position 2
6.2% 19.5% 12.9% 23.6% Customers (2017A)
1 Based on average B2C and B2B Mobile subscribers for each year. 2 Based on GlobalData as of June-18. 3 Adjusted EBITDA refers to the Adjusted EBITDA of the standalone business pre-synergies,
excluding management fees and other non-recurring items. Adjusted EBITDA is a non-IFRS measure.
19
3,935 4,163 4,277 4,675 2015A 2016A 2017A 2018A B2C + B2B Mobile Subs EoP ('000)
251 250 243 233 2015A 2016A 2017A 2018A 94 92 95 92 2015A 2016A 2017A 2018A 37.3% 39.1%
Revenue Adjusted EBITDA and Margin3
36.8% 39.6% $m
4.3M 7K 43K 66K
Mobile BB PayTV Fixed Voice
2015-18A
Coverage Map Spectrum Distribution
3G 4G 40 25 60 40 165 Nicaragua AWS 1,900 MHZ 850 MHZ 700 MHZ
Growing customer base Complementary business propositions Opportunity for further 4G penetration Stable cash flow generative asset
$3.8 $3.1 $3.5 $3.6
Combined #1
NM
#3 #2
Population coverage 2017A: 71% 51% MHz, paired Spectrum share: 45%
Mobile ARPU ($/month)1
Market Position 2
Customers (2017A)
1 Based on average B2C and B2B Mobile subscribers for each year. 2 Based on GlobalData as of June-18. 3 Adjusted EBITDA refers to the Adjusted EBITDA of the standalone business pre-synergies, excluding management fees and other non-recurring items.
Adjusted EBITDA is a non-IFRS measure. Impact from economic downturn and political environment
20
40 40 25 60 40 165 40 Claro CooTel 700 MHZ 850 MHZ 1,900 MHZ AWS 39 60 40 40 40 40 100 159 Claro Kolbi 850 MHz 1,800 MHz 1,900 / 2,100 MHz 2,600 MHz 20 20 20 25 20 30 30 65 50 50 Movil Claro Digicel 700 MHz 850 MHz 1,900 MHz
Source: Telefonica
1 Based on paired spectrum, total spectrum is x2. Spectrum holdings as of September 2018. 2 Kolbi only includes the spectrum currently in use
Panama
Total Spectrum: 65 MHz
Costa Rica
Total Spectrum: 100 MHz
Nicaragua
Total Spectrum: 165 MHz Ban Band and and Holdi
20 25 20 700 MHz 850 MHz 1,900 MHz 40 25 60 40 700 MHz 850 MHz 1,900 MHz AWS 10 50 40 850 MHz 1,800 MHz 1,900 / 2,100 MHz
Exp Expiry Yea ear 2036 2036 2036 2023 (+10) 2023 (+10) 2023 (+10) 2023 (+10) 2036 2036 | 2042 2036 | 2042 Holdi
Comp mparison
Solid #1 market position in terms of spectrum holdings, having secured licenses for the long term
21