(in Canadian dollars except as otherwise noted) To whom it may - - PDF document

in canadian dollars except as otherwise noted
SMART_READER_LITE
LIVE PREVIEW

(in Canadian dollars except as otherwise noted) To whom it may - - PDF document

April 8, 2019 Q1-2019 PRESENTATION CHANGES / NEW ACCOUNTING STANDARDS MD&A and/or Consolidated Financial Statements (in Canadian dollars except as otherwise noted) To whom it may concern, Effective Q1-2019, we have refined the way we report


slide-1
SLIDE 1

1

April 8, 2019 Q1-2019 PRESENTATION CHANGES / NEW ACCOUNTING STANDARDS MD&A and/or Consolidated Financial Statements (in Canadian dollars except as otherwise noted) To whom it may concern, Effective Q1-2019, we have refined the way we report the performance of our distribution channel, as well as investment/other expenses, to better align our reporting with how management views the results of our business. These changes, outlined in the section ‘Presentation changes’ below, have no impact on Net Operating Income (NOI), net income, or on 2019 growth guidance previously provided for distribution income and net investment income. Furthermore, on January 1, 2019, IFRS 16 (Leases) came into effect. The impact of this new accounting standard is outlined in the section ‘New Accounting standards’. PRESENTATION CHANGES A) Distribution EBITA will replace Net distribution income (MD&A basis)

1 Broker associates include joint ventures and brokers over which we have significant influence. The results from these investments

are accounted for using the equity method under IFRS. Distribution EBITA, which was previously disclosed in our statistical supplement, is better aligned with how management analyses the operating performance of our distribution channel, which is on a pre-tax, pre-interest basis. We also believe that Distribution EBITA is a more relevant measure to report our distribution performance as it:

  • is a key performance measure more commonly used across the industry;
  • results in both our consolidated brokers and our broker associates being reported on the same basis (before

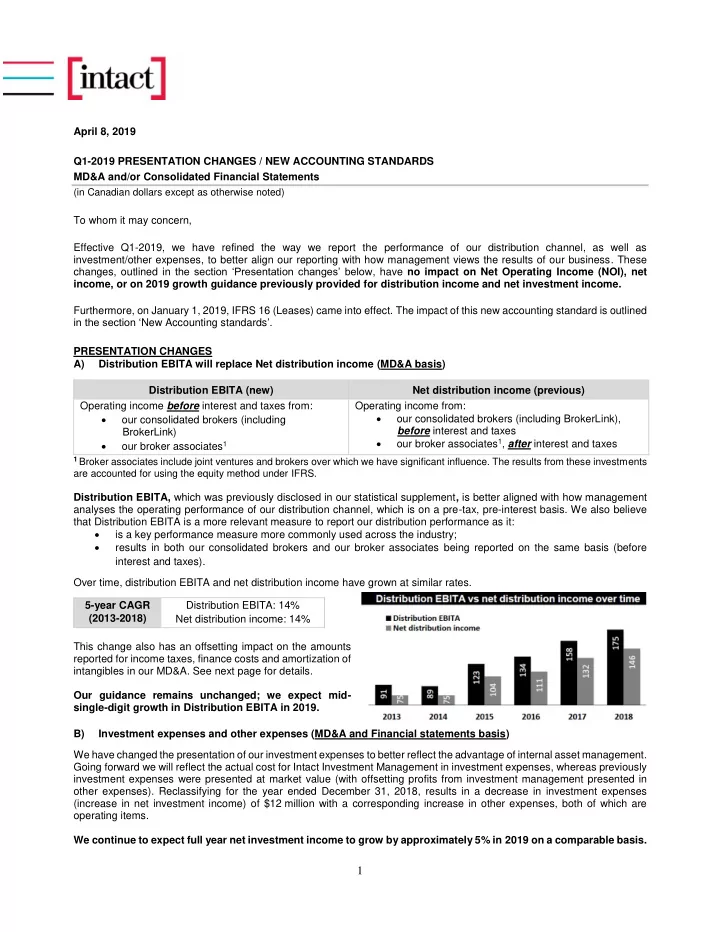
interest and taxes). Over time, distribution EBITA and net distribution income have grown at similar rates. This change also has an offsetting impact on the amounts reported for income taxes, finance costs and amortization of intangibles in our MD&A. See next page for details. Our guidance remains unchanged; we expect mid- single-digit growth in Distribution EBITA in 2019. B) Investment expenses and other expenses (MD&A and Financial statements basis) We have changed the presentation of our investment expenses to better reflect the advantage of internal asset management. Going forward we will reflect the actual cost for Intact Investment Management in investment expenses, whereas previously investment expenses were presented at market value (with offsetting profits from investment management presented in

  • ther expenses). Reclassifying for the year ended December 31, 2018, results in a decrease in investment expenses

(increase in net investment income) of $12 million with a corresponding increase in other expenses, both of which are

  • perating items.

We continue to expect full year net investment income to grow by approximately 5% in 2019 on a comparable basis. Distribution EBITA (new) Net distribution income (previous) Operating income before interest and taxes from:

  • ur consolidated brokers (including

BrokerLink)

  • ur broker associates1

Operating income from:

  • ur consolidated brokers (including BrokerLink),

before interest and taxes

  • ur broker associates1, after interest and taxes

5-year CAGR (2013-2018) Distribution EBITA: 14% Net distribution income: 14%

slide-2
SLIDE 2

2

Reclassification of comparative periods We will reclassify the comparative figures in our Q1-2019 reports in order to ensure comparability and consistency with this new presentation. The impact of these presentation changes for Q1-2018 and FY 2018 are presented in the tables below:

– Impact of changes (reclassifications for Q1-2018) – Impact of changes (reclassifications for FY-2018)

See the attached document for reclassified figures for the last 9 quarters and last five years. For the quarter ended March 31, 2018

As previously reported (A) Impact of Distribution EBITA (B) Investment vs

  • ther expenses

As reclassified Underwriting income 19

  • 19

Net investment income 122

  • 3

125 Distribution EBITA/Net distribution income 24 6

  • 30

Finance costs (25) (3)

  • (28)

Other income (expense) (1)

  • (3)

(4) PTOI 139 3

  • 142

Operating tax expense (19) (3)

  • (22)

NOI 120

  • 120

NOIPS (in dollars) 0.81

  • 0.81

Operating effective tax rate 13.5% 2.0 pts

  • 15.5%

Non-operating gains (losses) (19) (1)

  • (20)

Non-operating income tax recovery 2 1

  • 3

Net income 103

  • 103

Total effective tax rate 14.2% 1.4 pts

  • 15.6%

For the year ended Dec. 31, 2018 As previously reported (A) Impact of Distribution EBITA (B) Investment vs

  • ther expenses

As reclassified Underwriting income 474

  • 474

Net investment income 529

  • 12

541 Distribution EBITA/Net distribution income 146 29

  • 175

Finance costs (103) (11)

  • (114)

Other income (expense) (18)

  • (12)

(30) PTOI 1,028 18

  • 1,046

Operating tax expense (189) (18)

  • (207)

NOI 839

  • 839

NOIPS (in dollars) 5.74

  • 5.74

Operating effective tax rate 18.4% 1.4 pts

  • 19.8%

Non-operating gains (losses) (142) (5)

  • (147)

Non-operating income tax recovery 10 5

  • 15

Net income 707

  • 707

Total effective tax rate 20.2% 1.2 pts

  • 21.4%
slide-3
SLIDE 3

3

NEW ACCOUNTING STANDARDS IFRS 16 (Leases), effective January 1, 2019 As disclosed in Note 33.2 of our Consolidated Financial Statements for the year ended December 31, 2018, IFRS 16 (Leases) is effective for annual periods beginning on or after January 1, 2019. The standard requires lessees to recognize most leases on their balance sheets as right-of-use assets (representing the right to use the underlying assets), with the corresponding lease liabilities (representing the obligation to make lease payments). Operating lease expenses, which were previously mostly recorded in underwriting expenses, will be replaced by depreciation expenses (mostly recorded in underwriting expenses) and interest expenses (recorded in finance costs). We expect finance costs to increase by $3 million per quarter in 2019, with the overall impact on net income being minimal. The cumulative effect of adoption will be recognized in opening Retained earnings as at January 1, 2019, with no restatement to the comparative figures. The adoption of IFRS 16 will lead to the recognition of operating leases, mainly real estate leases. As a result, we expect to account for right-of-use assets of $358 million, lease liabilities of $441 million, write-off of net liabilities recognized under the previous standard of $29 million, and a reduction of shareholders’ equity of $39 million, net of income taxes. The impact of these balance sheet restatements is expected to have minimal impacts on our debt-to-total capital ratio, our MCT ratio and our total excess capital. For the definitions of measures and other insurance-related terms used in this document, refer to the MD&A and to the glossary available in the “Investors” section of our website at www.intactfc.com. Ken Anderson Vice President Investor Relations & Treasurer 1 855 646-8228 ext. 87383 kenneth.anderson@intact.net

slide-4
SLIDE 4

See below the impact on comparative periods of the presentation changes to be adopted in Q1-2019 (Distribution EBITA and investment/other expenses). Please see attached memo for an explanation of these changes.

CONSOLIDATED RESULTS

(in millions of Canadian dollars, except as otherwise noted)

2016 2018 2017 2016 2015 2014

#

Q4 Q3 Q2 Q1 Q4 Q3 Q2 Q1 Q4 Annual Annual Annual Annual Annual Underwriting income

1

210 152 93 19 178 170 103 35 153 474 486 375 628 519 Net investment income

2

143 136 137 125 125 105 109 109 108 541 448 429 439 438 Distribution EBITA

3

42 41 62 30 34 36 59 29 29 175 158 134 123 89 Finance costs

4

(30) (27) (29) (28) (28) (21) (20) (22) (21) (114) (91) (82) (71) (69) Other income (expense)

5

(9) (5) (12) (4) (2) (5) (5) 1 9 (30) (11) (5) (16) (21) Pre-tax operating income (PTOI)

6

356 297 251 142 307 285 246 152 278 1,046 990 851 1,103 956 Operating income tax benefit (expense)

7

(75) (60) (50) (22) (71) (66) (53) (29) (66) (207) (219) (191) (243) (189) Effective tax rate

8

21.1% 20.2% 19.9% 15.5% 23.1% 23.2% 21.5% 19.1% 23.7% 19.8% 22.1% 22.4% 22.0% 19.8% Net operating income (NOI)

9

281 237 201 120 236 219 193 123 212 839 771 660 860 767 Non-operating gains (losses)

10

(44) (37) (46) (20) (60) (62) 56 30 (53) (147) (36) (156) (219) 7 Income before income taxes

11

312 260 205 122 247 223 302 182 225 899 954 695 884 963 Income tax benefit (expense)

12

(68) (61) (44) (19) (15) (52) (59) (36) (54) (192) (162) (154) (178) (181) Effective tax rate

13

21.8% 23.5% 21.5% 15.6% 6.1% 23.3% 19.5% 19.8% 24.0% 21.4% 17.0% 22.2% 20.1% 18.8% Net income

14

244 199 161 103 232 171 243 146 171 707 792 541 706 782

Distribution EBITA

(in millions of Canadian dollars, except as otherwise noted)

2016 2018 2017 2016 2015 2014

#

Q4 Q3 Q2 Q1 Q4 Q3 Q2 Q1 Q4 Annual Annual Annual Annual Annual Net distribution income, as per MD&A

15

36 34 52 24 28 30 50 24 24 146 132 111 104 75 Growth YOY

16

28.6% 13.3% 4.0% 0.0% 16.7% 0.0% 16.3% 71.5% 9.1% 10.6% 18.9% 6.7% 38.7% 0.0%

  • Adjust. to report broker associates on an EBITA basis

Interest expense

17

3 2 3 3 3 2 1 3 3 11 9 10 7 5 Income taxes

18

3 5 7 3 3 4 8 2 2 18 17 13 12 9 Distribution EBITA

19

42 41 62 30 34 36 59 29 29 175 158 134 123 89 Growth YOY

20

23.5% 13.9% 5.1% 3.4% 17.2% 0.0% 15.7% 61.1% 7.4% 10.8% 17.9% 8.9% 38.2% (2.2)%

Net investment income

(in millions of Canadian dollars, except as otherwise noted)

2016 2018 2017 2016 2015 2014

#

Q4 Q3 Q2 Q1 Q4 Q3 Q2 Q1 Q4 Annual Annual Annual Annual Annual Interest income

21

94 89 85 83 81 65 65 64 66 351 275 265 281 288 Dividend income

22

55 53 57 48 50 45 49 50 47 213 194 184 179 174 Total investment income

23

149 142 142 131 131 110 114 114 113 564 469 449 460 462 Investment expenses

24

(6) (6) (5) (6) (6) (5) (5) (5) (5) (23) (21) (20) (21) (24) Net investment income

25

143 136 137 125 125 105 109 109 108 541 448 429 439 438 2017 2018

PRESENTATION CHANGES PRESENTATION CHANGES YoY GROWTH

2018 2017 2018 2017