
Bank of Montreal Second Quarter Report 2000
Page 1
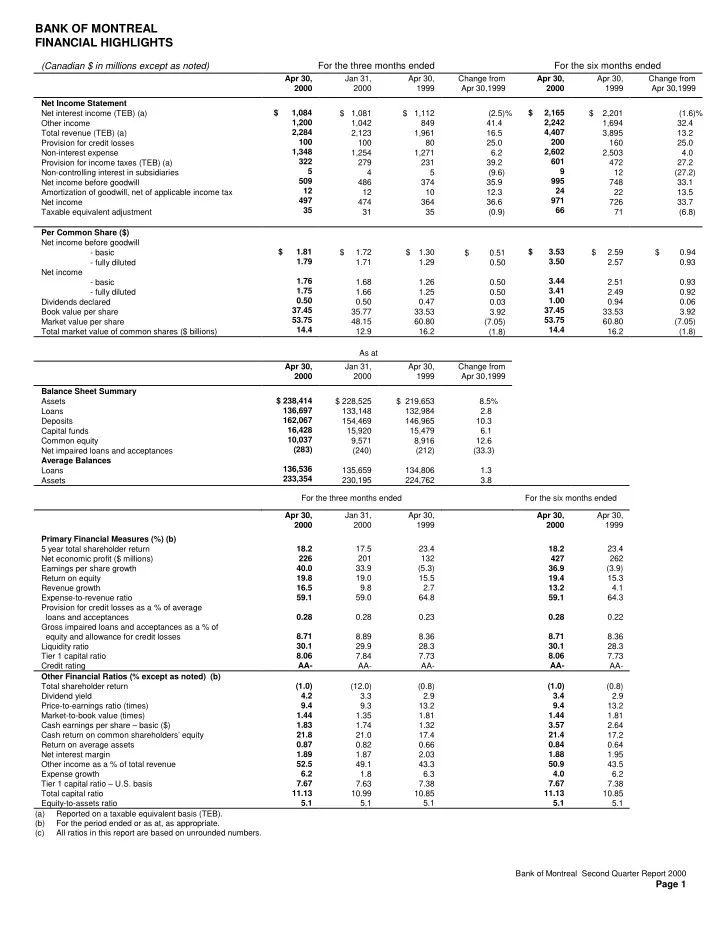
BANK OF MONTREAL FINANCIAL HIGHLIGHTS
(Canadian $ in millions except as noted) For the three months ended For the six months ended
Apr 30, 2000 Jan 31, 2000 Apr 30, 1999 Change from Apr 30,1999 Apr 30, 2000 Apr 30, 1999 Change from Apr 30,1999 Net Income Statement Net interest income (TEB) (a) Other income Total revenue (TEB) (a) Provision for credit losses Non-interest expense Provision for income taxes (TEB) (a) Non-controlling interest in subsidiaries Net income before goodwill Amortization of goodwill, net of applicable income tax Net income Taxable equivalent adjustment $ 1,084 1,200 2,284 100 1,348 322 5 509 12 497 35 $ 1,081 1,042 2,123 100 1,254 279 4 486 12 474 31 $ 1,112 849 1,961 80 1,271 231 5 374 10 364 35 (2.5)% 41.4 16.5 25.0 6.2 39.2 (9.6) 35.9 12.3 36.6 (0.9) $ 2,165 2,242 4,407 200 2,602 601 9 995 24 971 66 $ 2,201 1,694 3,895 160 2,503 472 12 748 22 726 71 (1.6)% 32.4 13.2 25.0 4.0 27.2 (27.2) 33.1 13.5 33.7 (6.8) Per Common Share ($) Net income before goodwill
- basic
- fully diluted
Net income
- basic
- fully diluted
Dividends declared Book value per share Market value per share Total market value of common shares ($ billions) $ 1.81 1.79 1.76 1.75 0.50 37.45 53.75 14.4 $ 1.72 1.71 1.68 1.66 0.50 35.77 48.15 12.9 $ 1.30 1.29 1.26 1.25 0.47 33.53 60.80 16.2 $ 0.51 0.50 0.50 0.50 0.03 3.92 (7.05) (1.8) $ 3.53 3.50 3.44 3.41 1.00 37.45 53.75 14.4 $ 2.59 2.57 2.51 2.49 0.94 33.53 60.80 16.2 $ 0.94 0.93 0.93 0.92 0.06 3.92 (7.05) (1.8) As at Apr 30, 2000 Jan 31, 2000 Apr 30, 1999 Change from Apr 30,1999 Balance Sheet Summary Assets Loans Deposits Capital funds Common equity Net impaired loans and acceptances Average Balances Loans Assets $ 238,414 136,697 162,067 16,428 10,037 (283) 136,536 233,354 $ 228,525 133,148 154,469 15,920 9,571 (240) 135,659 230,195 $ 219,653 132,984 146,965 15,479 8,916 (212) 134,806 224,762 8.5% 2.8 10.3 6.1 12.6 (33.3) 1.3 3.8 For the three months ended For the six months ended Apr 30, 2000 Jan 31, 2000 Apr 30, 1999 Apr 30, 2000 Apr 30, 1999 Primary Financial Measures (%) (b) 5 year total shareholder return Net economic profit ($ millions) Earnings per share growth Return on equity Revenue growth Expense-to-revenue ratio Provision for credit losses as a % of average loans and acceptances Gross impaired loans and acceptances as a % of equity and allowance for credit losses Liquidity ratio Tier 1 capital ratio Credit rating 18.2 226 40.0 19.8 16.5 59.1 0.28 8.71 30.1 8.06 AA- 17.5 201 33.9 19.0 9.8 59.0 0.28 8.89 29.9 7.84 AA- 23.4 132 (5.3) 15.5 2.7 64.8 0.23 8.36 28.3 7.73 AA- 18.2 427 36.9 19.4 13.2 59.1 0.28 8.71 30.1 8.06 AA- 23.4 262 (3.9) 15.3 4.1 64.3 0.22 8.36 28.3 7.73 AA- Other Financial Ratios (% except as noted) (b) Total shareholder return Dividend yield Price-to-earnings ratio (times) Market-to-book value (times) Cash earnings per share – basic ($) Cash return on common shareholders’ equity Return on average assets Net interest margin Other income as a % of total revenue Expense growth Tier 1 capital ratio – U.S. basis Total capital ratio Equity-to-assets ratio (1.0) 4.2 9.4 1.44 1.83 21.8 0.87 1.89 52.5 6.2 7.67 11.13 5.1 (12.0) 3.3 9.3 1.35 1.74 21.0 0.82 1.87 49.1 1.8 7.63 10.99 5.1 (0.8) 2.9 13.2 1.81 1.32 17.4 0.66 2.03 43.3 6.3 7.38 10.85 5.1 (1.0) 3.4 9.4 1.44 3.57 21.4 0.84 1.88 50.9 4.0 7.67 11.13 5.1 (0.8) 2.9 13.2 1.81 2.64 17.2 0.64 1.95 43.5 6.2 7.38 10.85 5.1 (a) Reported on a taxable equivalent basis (TEB). (b) For the period ended or as at, as appropriate. (c) All ratios in this report are based on unrounded numbers.