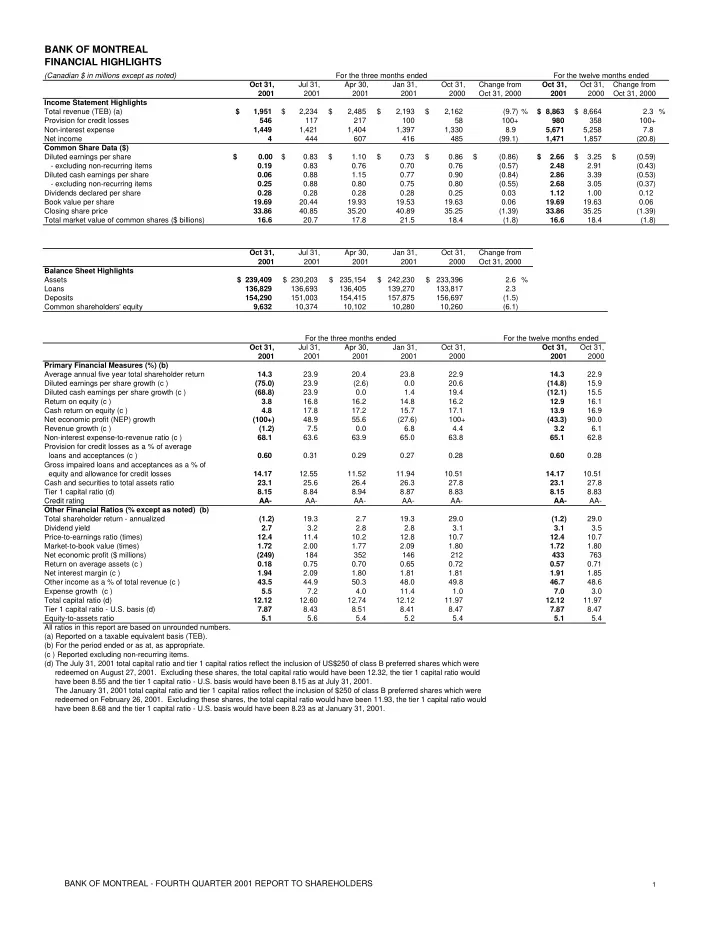

BANK OF MONTREAL FINANCIAL HIGHLIGHTS
(Canadian $ in millions except as noted) Oct 31, Jul 31, Apr 30, Jan 31, Oct 31, Oct 31, Oct 31, Change from 2001 2001 2001 2001 2000 2001 2000 Oct 31, 2000 Income Statement Highlights Total revenue (TEB) (a) 1,951 $ 2,234 $ 2,485 $ 2,193 $ 2,162 $ (9.7) % 8,863 $ 8,664 $ 2.3 % Provision for credit losses 546 117 217 100 58 100+ 980 358 100+ Non-interest expense 1,449 1,421 1,404 1,397 1,330 8.9 5,671 5,258 7.8 Net income 4 444 607 416 485 (99.1) 1,471 1,857 (20.8) Common Share Data ($) Diluted earnings per share $ 0.00 0.83 $ 1.10 $ 0.73 $ 0.86 $ (0.86) $ 2.66 $ 3.25 $ (0.59) $
- excluding non-recurring items
0.19 0.83 0.76 0.70 0.76 (0.57) 2.48 2.91 (0.43) Diluted cash earnings per share 0.06 0.88 1.15 0.77 0.90 (0.84) 2.86 3.39 (0.53)
- excluding non-recurring items
0.25 0.88 0.80 0.75 0.80 (0.55) 2.68 3.05 (0.37) Dividends declared per share 0.28 0.28 0.28 0.28 0.25 0.03 1.12 1.00 0.12 Book value per share 19.69 20.44 19.93 19.53 19.63 0.06 19.69 19.63 0.06 Closing share price 33.86 40.85 35.20 40.89 35.25 (1.39) 33.86 35.25 (1.39) Total market value of common shares ($ billions) 16.6 20.7 17.8 21.5 18.4 (1.8) 16.6 18.4 (1.8) Oct 31, Jul 31, Apr 30, Jan 31, Oct 31, 2001 2001 2001 2001 2000 Balance Sheet Highlights Assets 239,409 $ 230,203 $ 235,154 $ 242,230 $ 233,396 $ 2.6 % Loans 136,829 136,693 136,405 139,270 133,817 2.3 Deposits 154,290 151,003 154,415 157,875 156,697 (1.5) Common shareholders' equity 9,632 10,374 10,102 10,280 10,260 (6.1) For the twelve months ended Oct 31, Jul 31, Apr 30, Jan 31, Oct 31, Oct 31, Oct 31, 2001 2001 2001 2001 2000 2001 2000 Primary Financial Measures (%) (b) Average annual five year total shareholder return 14.3 23.9 20.4 23.8 22.9 14.3 22.9 Diluted earnings per share growth (c ) (75.0) 23.9 (2.6) 0.0 20.6 (14.8) 15.9 Diluted cash earnings per share growth (c ) (68.8) 23.9 0.0 1.4 19.4 (12.1) 15.5 Return on equity (c ) 3.8 16.8 16.2 14.8 16.2 12.9 16.1 Cash return on equity (c ) 4.8 17.8 17.2 15.7 17.1 13.9 16.9 Net economic profit (NEP) growth (100+) 48.9 55.6 (27.6) 100+ (43.3) 90.0 Revenue growth (c ) (1.2) 7.5 0.0 6.8 4.4 3.2 6.1 Non-interest expense-to-revenue ratio (c ) 68.1 63.6 63.9 65.0 63.8 65.1 62.8 Provision for credit losses as a % of average loans and acceptances (c ) 0.60 0.31 0.29 0.27 0.28 0.60 0.28 Gross impaired loans and acceptances as a % of equity and allowance for credit losses 14.17 12.55 11.52 11.94 10.51 14.17 10.51 Cash and securities to total assets ratio 23.1 25.6 26.4 26.3 27.8 23.1 27.8 Tier 1 capital ratio (d) 8.15 8.84 8.94 8.87 8.83 8.15 8.83 Credit rating AA- AA- AA- AA- AA- AA- AA- Other Financial Ratios (% except as noted) (b) Total shareholder return - annualized (1.2) 19.3 2.7 19.3 29.0 (1.2) 29.0 Dividend yield 2.7 3.2 2.8 2.8 3.1 3.1 3.5 Price-to-earnings ratio (times) 12.4 11.4 10.2 12.8 10.7 12.4 10.7 Market-to-book value (times) 1.72 2.00 1.77 2.09 1.80 1.72 1.80 Net economic profit ($ millions) (249) 184 352 146 212 433 763 Return on average assets (c ) 0.18 0.75 0.70 0.65 0.72 0.57 0.71 Net interest margin (c ) 1.94 2.09 1.80 1.81 1.81 1.91 1.85 Other income as a % of total revenue (c ) 43.5 44.9 50.3 48.0 49.8 46.7 48.6 Expense growth (c ) 5.5 7.2 4.0 11.4 1.0 7.0 3.0 Total capital ratio (d) 12.12 12.60 12.74 12.12 11.97 12.12 11.97 Tier 1 capital ratio - U.S. basis (d) 7.87 8.43 8.51 8.41 8.47 7.87 8.47 Equity-to-assets ratio 5.1 5.6 5.4 5.2 5.4 5.1 5.4 All ratios in this report are based on unrounded numbers. (a) Reported on a taxable equivalent basis (TEB). (b) For the period ended or as at, as appropriate. (c ) Reported excluding non-recurring items. (d) The July 31, 2001 total capital ratio and tier 1 capital ratios reflect the inclusion of US$250 of class B preferred shares which were redeemed on August 27, 2001. Excluding these shares, the total capital ratio would have been 12.32, the tier 1 capital ratio would have been 8.55 and the tier 1 capital ratio - U.S. basis would have been 8.15 as at July 31, 2001. The January 31, 2001 total capital ratio and tier 1 capital ratios reflect the inclusion of $250 of class B preferred shares which were redeemed on February 26, 2001. Excluding these shares, the total capital ratio would have been 11.93, the tier 1 capital ratio would have been 8.68 and the tier 1 capital ratio - U.S. basis would have been 8.23 as at January 31, 2001. For the three months ended Change from Oct 31, 2000 For the twelve months ended Change from Oct 31, 2000 For the three months ended
BANK OF MONTREAL - FOURTH QUARTER 2001 REPORT TO SHAREHOLDERS
1