
Bank of Montreal First Quarter Report 2000
Page Page Page Page 1 1 1 1
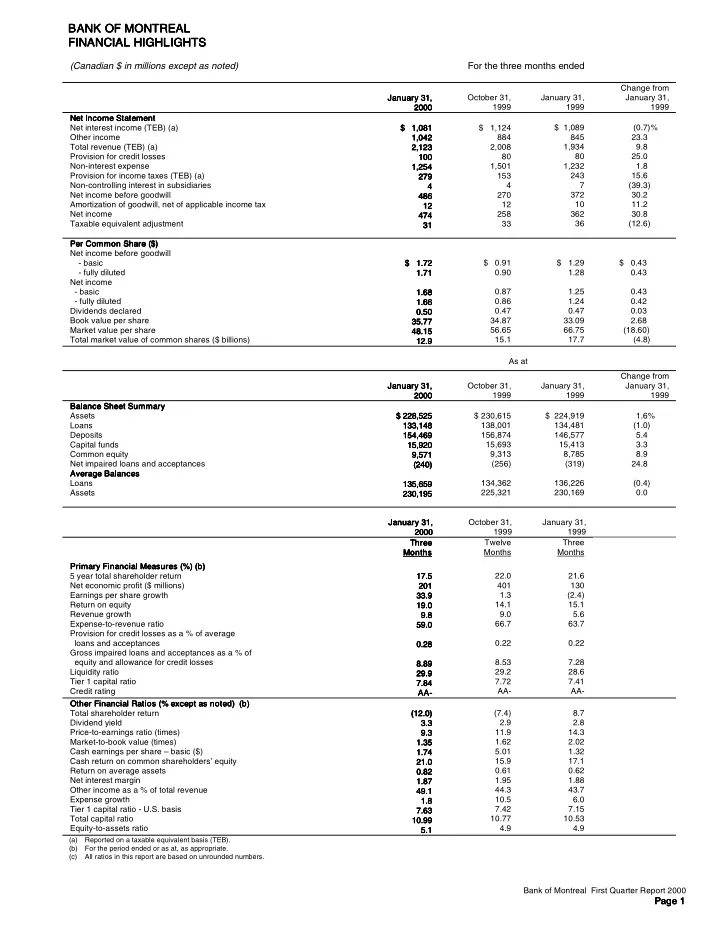
BANK OF MONTREAL BANK OF MONTREAL BANK OF MONTREAL BANK OF MONTREAL FINANCIAL HIGHLIGHTS FINANCIAL HIGHLIGHTS FINANCIAL HIGHLIGHTS FINANCIAL HIGHLIGHTS
(Canadian $ in millions except as noted) For the three months ended
January 31, January 31, January 31, January 31, 2000 2000 2000 2000 October 31, 1999 January 31, 1999 Change from January 31, 1999 Net Income Statement Net Income Statement Net Income Statement Net Income Statement Net interest income (TEB) (a) Other income Total revenue (TEB) (a) Provision for credit losses Non-interest expense Provision for income taxes (TEB) (a) Non-controlling interest in subsidiaries Net income before goodwill Amortization of goodwill, net of applicable income tax Net income Taxable equivalent adjustment $ 1,081 $ 1,081 $ 1,081 $ 1,081 1,042 1,042 1,042 1,042 2,123 2,123 2,123 2,123 100 100 100 100 1,254 1,254 1,254 1,254 279 279 279 279 4 4 4 4 486 486 486 486 12 12 12 12 474 474 474 474 31 31 31 31 $ 1,124 884 2,008 80 1,501 153 4 270 12 258 33 $ 1,089 845 1,934 80 1,232 243 7 372 10 362 36 (0.7)% 23.3 9.8 25.0 1.8 15.6 (39.3) 30.2 11.2 30.8 (12.6) Per Common Share ($) Per Common Share ($) Per Common Share ($) Per Common Share ($) Net income before goodwill
- basic
- fully diluted
Net income
- basic
- fully diluted
Dividends declared Book value per share Market value per share Total market value of common shares ($ billions) $ 1.72 $ 1.72 $ 1.72 $ 1.72 1.71 1.71 1.71 1.71 1.68 1.68 1.68 1.68 1.66 1.66 1.66 1.66 0.50 0.50 0.50 0.50 35.77 35.77 35.77 35.77 48.15 48.15 48.15 48.15 12.9 12.9 12.9 12.9 $ 0.91 0.90 0.87 0.86 0.47 34.87 56.65 15.1 $ 1.29 1.28 1.25 1.24 0.47 33.09 66.75 17.7 $ 0.43 0.43 0.43 0.42 0.03 2.68 (18.60) (4.8) As at January 31, January 31, January 31, January 31, 2000 2000 2000 2000 October 31, 1999 January 31, 1999 Change from January 31, 1999 Balance Sheet Summary Balance Sheet Summary Balance Sheet Summary Balance Sheet Summary Assets Loans Deposits Capital funds Common equity Net impaired loans and acceptances Average Balances Average Balances Average Balances Average Balances Loans Assets $ 228,525 $ 228,525 $ 228,525 $ 228,525 133,148 133,148 133,148 133,148 154,469 154,469 154,469 154,469 15,920 15,920 15,920 15,920 9,571 9,571 9,571 9,571 (240) (240) (240) (240) 135,659 135,659 135,659 135,659 230,195 230,195 230,195 230,195 $ 230,615 138,001 156,874 15,693 9,313 (256) 134,362 225,321 $ 224,919 134,481 146,577 15,413 8,785 (319) 136,226 230,169 1.6% (1.0) 5.4 3.3 8.9 24.8 (0.4) 0.0 January 31, January 31, January 31, January 31, 2000 2000 2000 2000 October 31, 1999 January 31, 1999 Three Three Three Three Months Months Months Months Twelve Months Three Months Primary Financial Measures (%) (b) Primary Financial Measures (%) (b) Primary Financial Measures (%) (b) Primary Financial Measures (%) (b) 5 year total shareholder return Net economic profit ($ millions) Earnings per share growth Return on equity Revenue growth Expense-to-revenue ratio Provision for credit losses as a % of average loans and acceptances Gross impaired loans and acceptances as a % of equity and allowance for credit losses Liquidity ratio Tier 1 capital ratio Credit rating 17.5 17.5 17.5 17.5 201 201 201 201 33.9 33.9 33.9 33.9 19.0 19.0 19.0 19.0 9.8 9.8 9.8 9.8 59.0 59.0 59.0 59.0 0.28 0.28 0.28 0.28 8.89 8.89 8.89 8.89 29.9 29.9 29.9 29.9 7.84 7.84 7.84 7.84 AA- AA- AA- AA- 22.0 401 1.3 14.1 9.0 66.7 0.22 8.53 29.2 7.72 AA- 21.6 130 (2.4) 15.1 5.6 63.7 0.22 7.28 28.6 7.41 AA- Other Financial Ratios (% except as noted) (b) Other Financial Ratios (% except as noted) (b) Other Financial Ratios (% except as noted) (b) Other Financial Ratios (% except as noted) (b) Total shareholder return Dividend yield Price-to-earnings ratio (times) Market-to-book value (times) Cash earnings per share – basic ($) Cash return on common shareholders’ equity Return on average assets Net interest margin Other income as a % of total revenue Expense growth Tier 1 capital ratio - U.S. basis Total capital ratio Equity-to-assets ratio (12.0) (12.0) (12.0) (12.0) 3.3 3.3 3.3 3.3 9.3 9.3 9.3 9.3 1.35 1.35 1.35 1.35 1.74 1.74 1.74 1.74 21.0 21.0 21.0 21.0 0.82 0.82 0.82 0.82 1.87 1.87 1.87 1.87 49.1 49.1 49.1 49.1 1.8 1.8 1.8 1.8 7.63 7.63 7.63 7.63 10.99 10.99 10.99 10.99 5.1 5.1 5.1 5.1 (7.4) 2.9 11.9 1.62 5.01 15.9 0.61 1.95 44.3 10.5 7.42 10.77 4.9 8.7 2.8 14.3 2.02 1.32 17.1 0.62 1.88 43.7 6.0 7.15 10.53 4.9
(a) Reported on a taxable equivalent basis (TEB). (b) For the period ended or as at, as appropriate. (c) All ratios in this report are based on unrounded numbers.