
SLIDE 1
IMPROVING SALT TOLERANCE OF WHEAT Rana Munns CSIRO Plant Industry, - - PowerPoint PPT Presentation
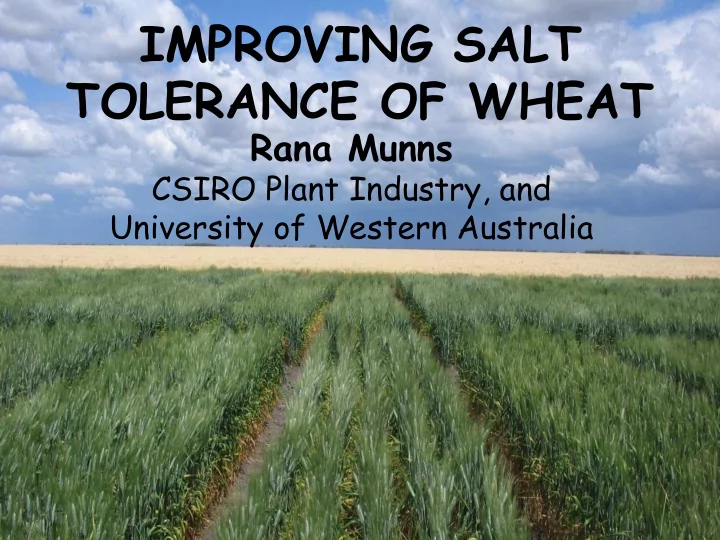
IMPROVING SALT TOLERANCE OF WHEAT Rana Munns CSIRO Plant Industry, and University of Western Australia The food demand gap Environmental Issues Loss of biodiversity Drought Biotic stress Salinity Outline of talk Two types of dryland
Salinity Biotic stress Drought Loss of biodiversity
the sea via wind and rain
rainfall and the type of vegetation
brings salt to the surface of cleared land
below the soil surface, in the root zone
Perth Sydney Adelaide Brisbane Melbourne Hobart Cairns
Where rainfall exceeds crop use, and unused water escapes below the roots, rising water tables can bring the salt to the surface
WA NSW WA Secondary salinity – seepage or “rising watertable” salinity
Salt rises to the surface Salt stays below ground
Aust J Exp Ag 2002;
“seepage salinity” surface sodicity is indicative of subsoil or “transient salinity”
Primary salinity – subsoil or “transient” salinity
Where crop use exceeds rainfall, salts concentrate in the root zone
soil surface 2 4 6 8 10
Metres below soil surface
50 100 150 mM NaCl (1/3 seawater)
Based on YP Dang et al. Aust J Soil Res, (2010) Fig 5.
Indian Ocean Climate Initiative Note No 5 (2005)
Indian Ocean Climate Initiative Note No 5 (2005)
NaCl (mM)
200 400 600 800
Shoot DW (% control)
20 40 60 80 100 120 tall wheatgrass wheat saltbush rice
seawater
Old man saltbush Atriplex nummularia with inter-rows of tall wheatgrass
Ed Barrett-Lennard,DAFWA & UWA
“Every saltbush plant paid for itself in the 2001/02 drought… “
Photo M. Lloyd
“ …and again in floods of Jan 2006”
Ed Barrett-Lennard, DAFWA & UWA
(scanning electron micrograph
by Richard Storey)
NaCl (mM) 50 100 150 200 250 300
Shoot growth (% control)
20 40 60 80 100
tall wheatgrass barley wheat durum wheat sea barleygrass
Colmer, Munns and Flowers, Aust J Exp Agric (2005)
10 20 30 40
Time after NaCl added (d)
1 2 3 4 5
Total dry weight (g)
Control Salt
Osmotic effect Salt- specific effect
bread wheat durum wheat
Munns et al. Aust J Plant Phys (1996)
Salt exclusion Tissue tolerance
Root cell - salt excluded Leaf cell - salt stored safely in vacuole NaCl NaCl
1. 2. 3.
Na+ concentration (mol gDW-1)
200 400 600 800 1000 1200 1400 Tamaroi Wollaroi Janz High Na+ Low Na+ durum landrace durum landrace (bread) (durum) (durum)
Nax2: Unloads Na+ from the xylem in roots
(HKT1;5)
Nax1: Unloads Na+ from the xylem in roots and leaf base
(HKT1;4)
Unique durum derivative Line 149 (a result of a previous cross between Triticum monococcum and a durum rust-sensitive cultivar for the purpose
durum cultivar Tamaroi
Richard James, CSIRO Plant Industry
Andrew Smart (PCT, Narrabri) - 2008
350 450 500 300 250 200 150 400
N 1 km
ECa (mS m-1)
350 450 500 300 250 200 150 400
N 1 km
350 450 500 300 250 200 150 400 350 450 500 300 250 200 150 400
N 1 km
ECa (mS m-1)
Munns et al, Nature Biotechnology, 2012
Ray Hare, durum breeder, NSW DPI Richard James, CSIRO
0 - 20 20 - 40 40 - 60 60 - 80 80 - 90 BLOCK 3 BLOCK 2 BLOCK 1 50 100 150 200 250 300 Chloride concentration in soil solution (mM) Soil depth (cm)
ECa (DS/m)
260 280 300 320 340 360 380 400 420 440 460 480
Grain yield (t/ha)
0.5 1.0 1.5 2.0 2.5 3.0 3.5 Block 1 Block 2 Block 3
+ Nax2
Site mean yield (t/ha)
1.0 1.5 2.0 2.5 3.0 3.5
Yield (% Tamaroi)
70 80 90 100 110 120 130
200 309 336 400 236 (ECa)
Yuluma 2009 Ashley 2008 Ashley2009 (Block 1) (Block 2) (Block 3)
Nax2 lines 5004 5042
High salinity Moderate to low salinity
James et al. Funct. Plant Biol (2012)
Field 2, Moree 2009 Field 1 Block 1 Block 2 Block 3 Grain yield (% Tamaroi) 80 90 100 110 120 Moree 2008
*
Munns et al, Nature Biotechnology (2012)
Carol Blake (CSIRO Plant Industry) making crosses between durum wheat (male) containing Nax genes and bread wheat (female) parents
Salt underlies all Australian soils Where rainfall is low, crops use all the water so salt concentrations increase in the subsoil. Crops must be salt tolerant Where rainfall is high, water escapes below the roots and rising watertables bring salt to the
be very salt tolerant Genetic improvement in salt tolerance will be fastest when laboratory scientists work together with agronomists and breeders
CSIRO Plant Industry Richard James Carol Blake Caitlin Byrt Shaobai Huang Evans Lagudah Wolfgang Spielmeyer Mark Tester, ACPFG Matthew Gilliham, Uni Adelaide Collaborating Breeders: Ray Hare, NSW DPI Tony Rathjen, Uni Adelaide Andrew and Jodie Crowe (growers, northern NSW)