
SLIDE 1
Lessons from Oakland
Jamie Parks, City of Oakland October 16, 2014
Implementing the NACTO USDG Lessons from Oakland Jamie Parks, City - - PowerPoint PPT Presentation
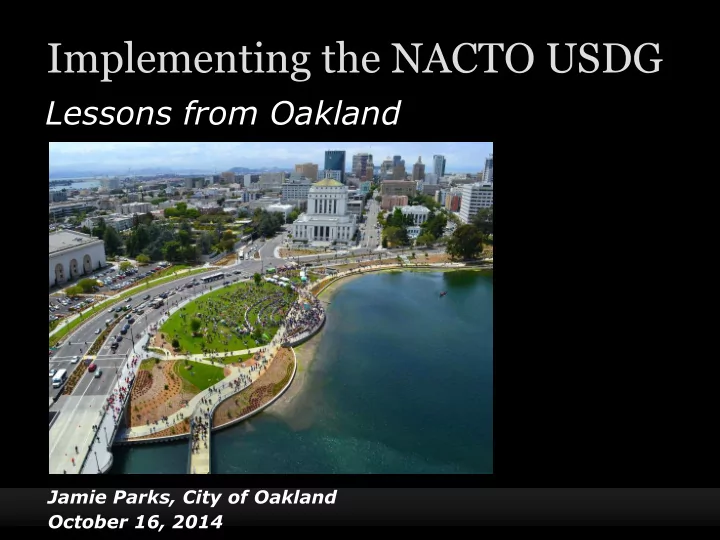
Implementing the NACTO USDG Lessons from Oakland Jamie Parks, City of Oakland October 16, 2014 Latham Square Iconic Intersection Intersection of prominent corridors Historic architecture Cathedral Building Rotunda Building Gateway
Jamie Parks, City of Oakland October 16, 2014
Intersection of prominent corridors Historic architecture
– Cathedral Building – Rotunda Building
Gateway to Uptown
Complex turning movements Poor pedestrian connectivity Usable pedestrian space limited
Under design 2004-2012
– Many compromises along the way
Bicycle Crashes (2007-2011)
Pedestrian Crashes (2007-2011)
Severe Injury Crashes (2007-2011)
Bicycling up 300% in past 15 years (130 bicycles per hour)
Minimum bike lane widths Continued multiple threat risk No speeding reduction No more center left-turn lane
Minimum bike lane widths Continued multiple threat risk No speeding reduction No more center left-turn lane
Maintain existing speeds through far-side stops
– Effective use of existing signal priority equipment
Eliminate bus-bike conflicts Improve stop amenities Reduce friction through buffered (not protected) bike lanes
Buffered or protected bike lanes
– Remove travel lane in each direction
Transit boarding islands Right turn lanes at major intersections
Eliminate bus-bike weaving Provide space for shelters and benches
More congestion (and transit delay)? Remove on-street parking?
Location # of Spaces Percent Change 20th – 34th
34th – 44th
44th – 51st
51st – 57th
Total
Estimated change in parking supply
Necessary but insufficient
Attend webinars Cities for Cycling Road Show
Talk about real-life projects and issues
Revise standard details Specific (and strong) policy language Make it easy!
Jamie Parks Complete Street Program Manager City of Oakland (510) 238-6613 jparks@oaklandnet.com