
June 27, 2017 Note: ■Forward-looking statements, such as business forecasts, made in these financial statements are based on managements’ estimates, assumptions and projections at the time of publication and do not represent a commitment from Ajinomoto Co., Inc. that they will be achieved. A number of factors could cause actual results to differ materially from expectations. ■Figures in this material are unaudited and subject to change. ■Yen amounts presented in these materials are truncated for amounts in millions and in billions. ■In these materials, “-” indicates that an amount has not been recognized, and “0” indicates a fractional amount due to rounding.
- 1. Financial Statement Overview
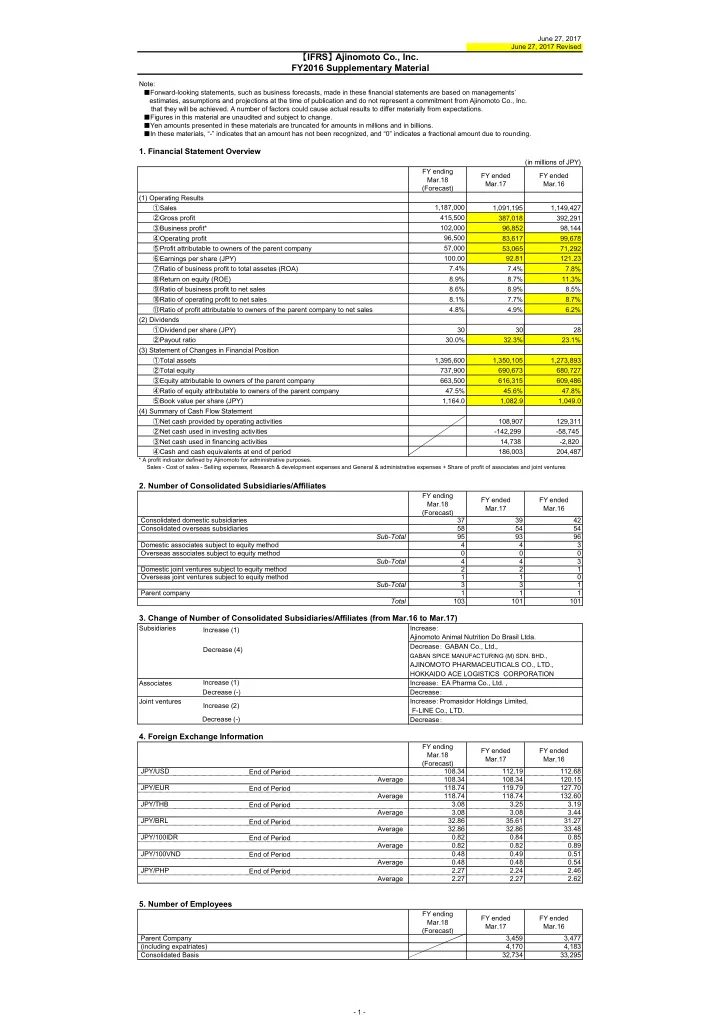
(in millions of JPY) FY ending Mar.18 (Forecast) FY ended Mar.17 FY ended Mar.16 (1) Operating Results ①Sales 1,187,000 1,091,195 1,149,427 ②Gross profit 415,500 387,018 392,291 ③Business profit* 102,000 96,852 98,144 ④Operating profit 96,500 83,617 99,678 ⑤Profit attributable to owners of the parent company 57,000 53,065 71,292 ⑥Earnings per share (JPY) 100.00 92.81 121.23 ⑦Ratio of business profit to total assetes (ROA) 7.4% 7.4% 7.8% ⑧Return on equity (ROE) 8.9% 8.7% 11.3% ⑨Ratio of business profit to net sales 8.6% 8.9% 8.5% ⑩Ratio of operating profit to net sales 8.1% 7.7% 8.7% ⑪Ratio of profit attributable to owners of the parent company to net sales 4.8% 4.9% 6.2% (2) Dividends ①Dividend per share (JPY) 30 30 28 ②Payout ratio 30.0% 32.3% 23.1% (3) Statement of Changes in Financial Position ①Total assets 1,395,600 1,350,105 1,273,893 ②Total equity 737,900 690,673 680,727 ③Equity attributable to owners of the parent company 663,500 616,315 609,486 ④Ratio of equity attributable to owners of the parent company 47.5% 45.6% 47.8% ⑤Book value per share (JPY) 1,164.0 1,082.9 1,049.0 (4) Summary of Cash Flow Statement ①Net cash provided by operating activities 108,907 129,311 ②Net cash used in investing activities
- 142,299
- 58,745
③Net cash used in financing activities 14,738
- 2,820
④Cash and cash equivalents at end of period 186,003 204,487
* A profit indicator defined by Ajinomoto for administrative purposes.
- 2. Number of Consolidated Subsidiaries/Affiliates
FY ending Mar.18 (Forecast) FY ended Mar.17 FY ended Mar.16 Consolidated domestic subsidiaries 37 39 42 Consolidated overseas subsidiaries 58 54 54 Sub-Total 95 93 96 Domestic associates subject to equity method 4 4 3 Overseas associates subject to equity method Sub-Total 4 4 3 Domestic joint ventures subject to equity method 2 2 1 Overseas joint ventures subject to equity method 1 1 Sub-Total 3 3 1 Parent company 1 1 1 Total 103 101 101
- 3. Change of Number of Consolidated Subsidiaries/Affiliates (from Mar.16 to Mar.17)
Subsidiaries Increase: Decrease: GABAN Co., Ltd., HOKKAIDO ACE LOGISTICS CORPORATION Associates Increase: EA Pharma Co., Ltd. , Decrease: Joint ventures Increase:Promasidor Holdings Limited, F-LINE Co., LTD. Decrease:
- 4. Foreign Exchange Information
FY ending Mar.18 (Forecast) FY ended Mar.17 FY ended Mar.16 JPY/USD 108.34 112.19 112.68 Average 108.34 108.34 120.15 JPY/EUR 118.74 119.79 127.70 Average 118.74 118.74 132.60 JPY/THB 3.08 3.25 3.19 Average 3.08 3.08 3.44 JPY/BRL 32.86 35.61 31.27 Average 32.86 32.86 33.48 JPY/100IDR 0.82 0.84 0.85 Average 0.82 0.82 0.89 JPY/100VND 0.48 0.49 0.51 Average 0.48 0.48 0.54 JPY/PHP 2.27 2.24 2.46 Average 2.27 2.27 2.62
- 5. Number of Employees
FY ending Mar.18 (Forecast) FY ended Mar.17 FY ended Mar.16 Parent Company 3,459 3,477 (including expatriates) 4,170 4,183 Consolidated Basis 32,734 33,295 AJINOMOTO PHARMACEUTICALS CO., LTD., June 27, 2017 Revised
【IFRS】 Ajinomoto Co., Inc. FY2016 Supplementary Material
Sales - Cost of sales - Selling expenses, Research & development expenses and General & administrative expenses + Share of profit of associates and joint ventures
Ajinomoto Animal Nutrition Do Brasil Ltda.
GABAN SPICE MANUFACTURING (M) SDN. BHD.,
End of Period End of Period End of Period End of Period End of Period End of Period Increase (1) Decrease (4) Increase (1) Decrease (-) End of Period Increase (2) Decrease (-)
- 1 -