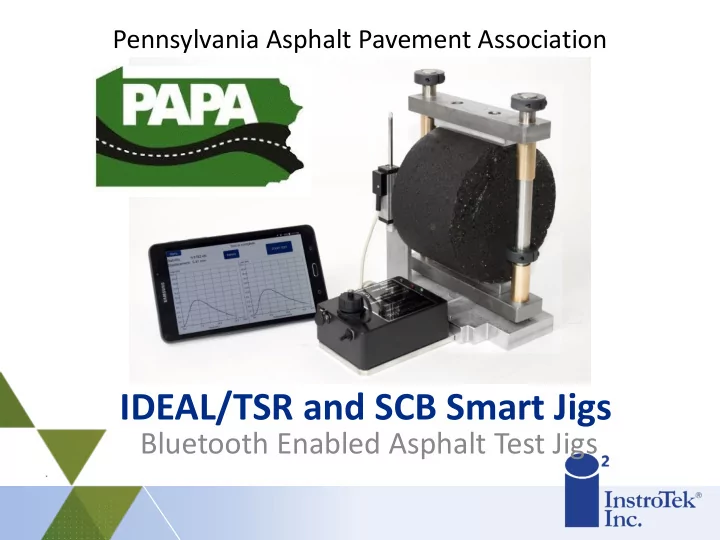

Pennsylvania Asphalt Pavement Association InstroTek Asphalt Jigs IDEAL/TSR and SCB Smart Jigs Bluetooth Enabled Asphalt Test Jigs
InstroTek Asphalt Jigs Overview • Smart-Jigs (SCB & IDEAL-CT/TSR) • Manufacturer Update • HWT-Pro – Hamburg Verification/Calibration
The Balanced Mix Design
Cracking Tests University of Illinois – Urbana Champaign Illinois Flexibility Index Test (I-FIT) Additional Sample Preparation Analysis software 1 notch depth, difficult to cut, tile saw width, 50mm/min Louisiana State University-SCB Additional Sample Preparation 3 notch depths, 3mm blade width 0.5mm/min IDEAL–CT Texas A&M – College Station, TX Gaining most popularity Least sample preparation Uses AASHTO T283-style (TSR) Jig, 50mm/min
NO MORE CRACKING TESTS!
Older Loading Frames
InstroTek Smart Jigs IDEAL-CT/TSR Jig Smart-SCB
InstroTek Smart-Jig - Goal Our goal with the Smart-Jig is to minimize variance created by labs utilizing different manufacturer fames with different data collection software. Smart-Jig set up is simple and allows all users/technicians to gather information the same way. Full support is offered and easy tablet software upgrades via Google Play store
Smart-Jig Frame & Accessories 1. Jig w/ Bluetooth 2. USB Cable 3. Load Cell 4. Android Tablet 5. LVDT 6. Rod and Magnet 7. Power Cord 8. Lubricant 9. Analysis Software
“Smart-Jig” 2 Test in 1 IDEAL CT Tensile Strength Test (TSR) Self contained system No need to replace old frames Actual displacement measured using LVDT Digital results
IDEAL/TSR & Smart-SCB Advantages Easy to use Give new life to older load frames Digital test results gathered with the same equipment No clerical errors Easy test set-up Automatically displays peak strength, average speed and all necessary data for IDEAL/TSR results Perform multiple tests
Current Round Robin/State Studies NCAT Round-Robin Phase 1 testing complete, Phase 2 data still being evaluated – Sample Preparation Training Key VAA Round Robin is currently on hold as they are waiting on funding approval from the procurement department at VDOT Florida is putting together a Round Robin to develop a specification for their state. Details are currently being worked out Texas DOT is establishing criteria for QC Labs to use IDEAL-CT index for verification of Overlay Test results established in mix design
NCAT Round Robin Summary – Sample Preparation The phase two results for the Ideal-CT have been received from all of the participating labs. In this phase, the between-lab mean CT Index was 103.7, the standard deviation was 11.5, and the COV was 11.1%. These results reveal how much effect sample fabrication has on variability. In the case of the Ideal-CT test, the COV was reduced from 33.3% to 11.1% from Phase 1 to Phase 2, indicating that differences in sample fabrication from lab to lab contributed to two-thirds of the overall between-lab variability of the test. This is an important finding that emphasizes the need for thorough hands- on training as part of implementation plans for performance tests used in mix design or production testing.
August 30, 2019 – “The Letter” “ASTM D8225 Standard Test Method for Determination of Cracking Tolerance Index of Asphalt Mixture Using the Indirect Tensile Cracking Test at Intermediate Temperature, Section 6.1.1 says that the “[the axial loading device] shall be capable of maintaining a constant deformation rate of 50 ± 2.0 mm/min.” Pine has come to understand that its Pine 850T Test Press does not meet this requirement when testing an asphalt specimen and we don’t currently have a solution that will make it meet the requirement. Note that the system does still comply with AASHTO T245 and T283.”
September 27, 2019 – “The Response” Dear all, In last several weeks there have been some concerns on the results of Pine screw machine. To address the concerns, we tested 5 mixes with a servo-hydraulic machine manufactured by TestQuip and one screw machine produced by Pine, although this work is not in the scope of NCHRP implementation project. We also conducted some statistical analyses. My overall conclusions are: 1. There is NO statistically significant difference between these two machines 2. Pine screw machine in fact does not meet current ASTM D8225- 19. It MAY be necessary to change the tolerance of 50+-2mm/min.
Test results: between machines – “The Data” CT Index : No statistical difference between machines
Current Info – “The Specification” 4.1 A cylindrical specimen is centered in the fixture. The load is applied such that a constant load-line displacement (LLD) rate of 50.0 +/- 2.0 mm/min is obtained and maintained for the duration of the test.
Proposed Changes 4.1 A cylindrical specimen is centered in the fixture. The load is applied such that a constant load-line displacement (LLD) rate of 50.0 +/- 3.0 mm/min is obtained and averaged throughout the duration of the test.
SmartLoader Software Output
SmartLoader Software Output
Smart-SCB Performs data collection for both IFIT and LSU Test Protocols Self contained system No need to replace old load frames Actual displacement measured using LVDT Digital test results
HWT-Pro
Purpose of HWT-Pro Verify Requirements of AASHTO T324 for Hamburg Wheel Trackers (HWT) Rut Depth (Height) Weight Waveform Temperature Allow calibration of HWTs
Designed Uses Designed to work with SmarTracker, PMW, Cox and Sons, PTI units Can be used to adjust dead load on wheels Verification of sine wave Calibrate LVDTs InstroTek SmarTracker Troxler(PMW)/Cox and Sons 24
AASHTO T 324 Requirements Description Requirement Load (lbf) 158 ± 1.0 Speed (ft/s) 1.00 ± 0.066 Center of Waveform ± 0.5 inch of center of specimens Rut depth error 0.15 mm / 20 mm Temperature ± 1.0 C
Waveform Verification Relative location of center of waveform in tray Speed of wheel at center Length of wheel path Passes/minute RMSE of waveform compared to sine wave 26
Reports Verification Calibration
Questions? Brian O’Toole The InstroTek Companies Mobile – (919) 740-6260 botoole@instrotek.com
Recommend
More recommend