
SLIDE 1
IBWC Water Summit on Groundwater
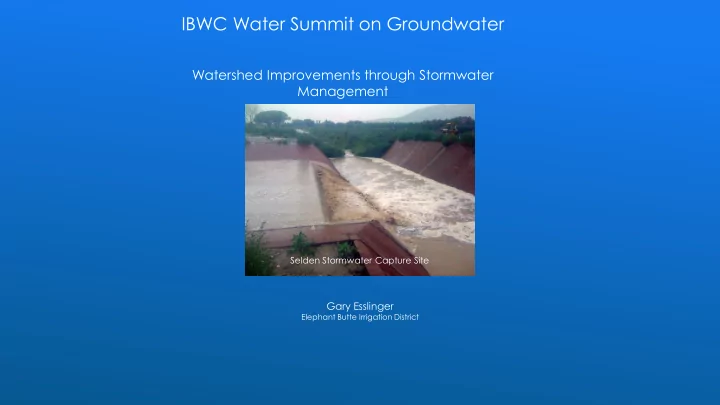
Watershed Improvements through Stormwater Management
Gary Esslinger
Elephant Butte Irrigation District
Selden Stormwater Capture Site
IBWC Water Summit on Groundwater Watershed Improvements through - - PowerPoint PPT Presentation
IBWC Water Summit on Groundwater Watershed Improvements through Stormwater Management Selden Stormwater Capture Site Gary Esslinger Elephant Butte Irrigation District Water Reuse: Converting wastewater to a useable resource A molecule of
Watershed Improvements through Stormwater Management
Gary Esslinger
Elephant Butte Irrigation District
Selden Stormwater Capture Site
Reservoir Rio Grande
Diversion Main Canals Laterals
Deliveries Drains
Downstream Users
Arrey Diversion Rincon Return Flow Leasburg Diversion Upper Mesilla Return Flow Mesilla Diversion Lower Mesilla Return Flow M&I Effluent El Paso Diversion Mexico Diversion Hudspeth Delivery M&I Effluent
Outflow
800.00 900.00 1000.00 1100.00 1200.00 1300.00 1400.00 1500.00 1600.00 DateTime 7/7/2012 2:30 7/7/2012 5:30 7/7/2012 8:30 7/7/2012 11:30 7/7/2012 14:30 7/7/2012 17:30 7/7/2012 20:30 7/7/2012 23:30 7/8/2012 2:30 7/8/2012 5:30 7/8/2012 8:30 7/8/2012 11:30 7/8/2012 14:30 7/8/2012 17:30 7/8/2012 20:30 CFS
Leasburg Cable
FlowCalc
RTU Technicians Types of Monitoring Sites
Gate Automation Site - Leasburg RTU & Pneumatic Bubbler Sensor
Rain Gauges (6) Rain Gauges (2) Rain Gauges (4) Rain Gauges (4)
2014 – OneRain Contrail Monitoring Software
Text & Email Alerts
August 9th, 2016 – August 8th, 2017
Associated Groundwater Monitoring Well MES_42R
Year Hours Captured ACFT 2015 54.5 56.3 2016 79.0 313.7 2017 104.5 341.4 2018 28.5 43.4
Year Hours Captured ACFT 2015 0.0 0.0 2016 117.5 132.6 2017 65.5 257.1 2018 84.5 379.2
Year Hours Captured ACFT 2015 0.0 0.0 2016 98.5 134.7 2017 58.5 319.6 2018 3.5 5.5 Total Hours Total Gallons Total ACFT 266.5 245,988,517 754.8 Total Hours Total Gallons Total ACFT 267.5 250,574,766 768.9 Total Hours Total Gallons Total ACFT 160.5 149,850,880 459.8
Yearly Total 56.4 580.9 918.1 428.1
Flood Control Dams – 28 Sites
WaterSmart Grant
Questions or Comments? Flood Control Dams