
THE AMERICAN ECONOMIC REVIEW DECEMBER 2001
HKG
I
I
ARG PAN
- .
KEN
, , n r r h l
CIV
MG3
I
I I
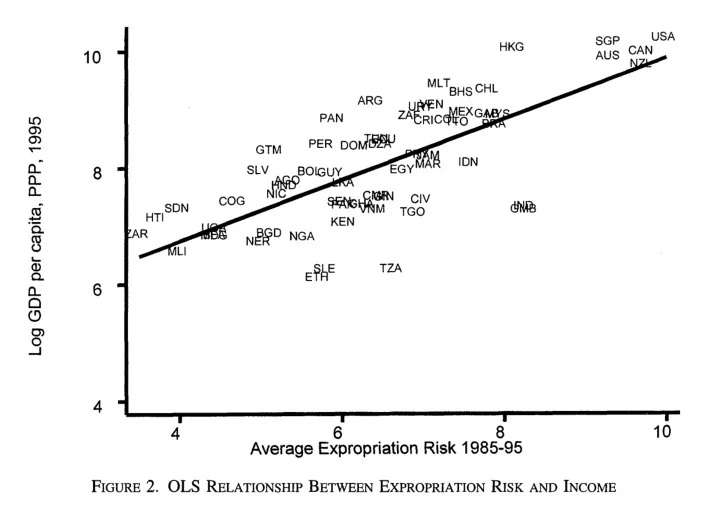
4 6 8 Average Expropriation Risk 1985-95 FIGURE
- 2. OLS RELATIONSHIP
BETWEEN EXPROPRIATION RISKAND INCOME
I
10
- downwards. All of these problems could be
solved if we had an instrument for institutions. Such an instrument must be an important factor in accounting for the institutional variation that we observe, but have no direct effect on perfor-
- mance. Our discussion in Section I suggests that
settler mortality during the time of colonization is a plausible instrument.
- 111. Mortality of Early Settlers
- A. Sources of European Mortality
in the Colonies In this subsection, we give a brief overview
- f the sources of mortality facing potential set-
- tlers. Malaria (particularly Plasmodium falcipo-
rum) and yellow fever were the major sources
- f European mortality in the colonies. In the
tropics, these two diseases accounted for 80 percent of European deaths, while gastrointes- tinal diseases accounted for another 15 percent (Curtin, 1989 p. 30). Throughout the nineteenth century, areas without malaria and yellow fever, such as New Zealand, were more healthy than Europe because the major causes of death in Europe-tuberculosis, pneumonia, and small- pox-were rare in these places (Curtin, 1989 p 13). Both malaria and yellow fever are transmit- ted by mosquito vectors. In the case of malaria, the main transmitter is the Anopheles gambiae complex and the mosquito Anopheles funestus, while the main carrier of yellow fever is Aedes
- aegypti. Both malaria and yellow fever vectors
tend to live close to human habitation. In places where the malaria vector is present, such as the West African savanna or forest. an individual can get as many as several hundred infectious mosquito bites a year. For a person without immunity, malaria (particularly Plas- modium falciporum) is often fatal, so Europe- ans in Africa, India, or the Caribbean faced very high death rates. In contrast, death rates for the adult local population were much lower (see Curtin [I9641 and the discussion in our intro- duction above). Curtin (1998 pp. 7-8) describes this as follows: Children in West Africa ... would be in- fected with malaria parasites shortly after birth and were frequently reinfected after- wards; if they lived beyond the age of about five, they acquired an apparent im-
- munity. The parasite remained with them,
normally in the liver, but clinical symp- toms were rare so long as they continued to be infected with the same species of P. falciporum.