
SLIDE 1
1
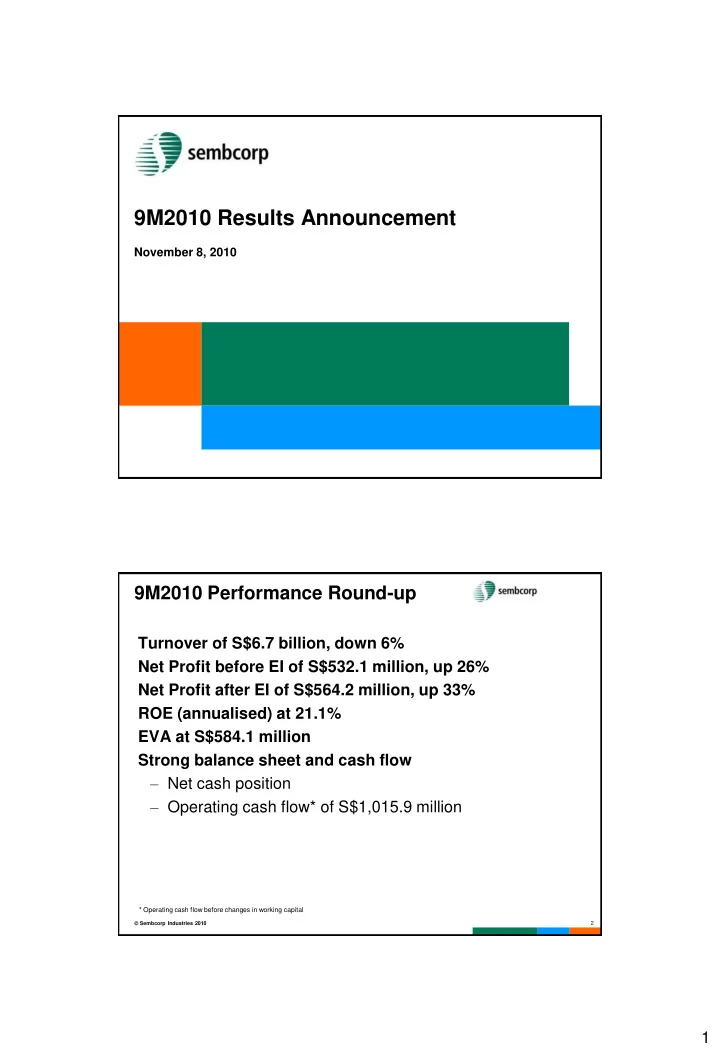
9M2010 Results Announcement
November 8, 2010
9M2010 Performance Round-up
Turnover of S$6.7 billion, down 6% Net Profit before EI of S$532.1 million, up 26% Net Profit after EI of S$564.2 million, up 33% ROE (annualised) at 21.1% EVA at S$584.1 million Strong balance sheet and cash flow – Net cash position – Operating cash flow* of S$1,015.9 million
* Operating cash flow before changes in working capital
2 Sembcorp Industries 2010