Hurricanes and Climate Irma Katia Jose Tim Hall National - - PowerPoint PPT Presentation

hurricanes and climate
SMART_READER_LITE
LIVE PREVIEW

Hurricanes and Climate Irma Katia Jose Tim Hall National - - PowerPoint PPT Presentation

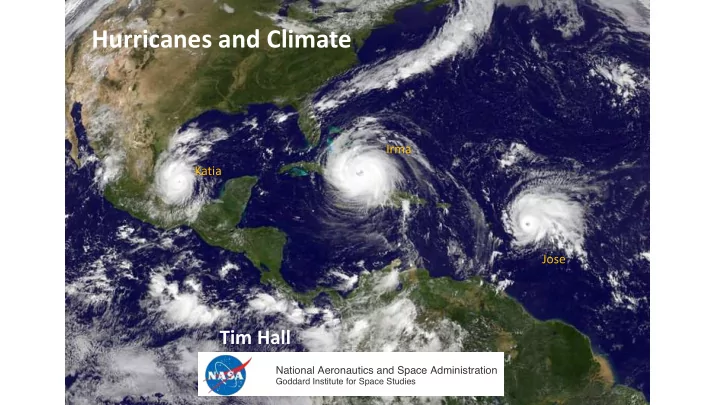
Hurricanes and Climate Irma Katia Jose Tim Hall National Aeronautics and Space Administration Goddard Institute for Space Studies Harvey, Texas 2017 North Atlantic Season Irma, Florida Keys 2017 saw


slide-1
SLIDE 1

Hurricanes ¡and ¡Climate

Tim ¡Hall

National Aeronautics and Space Administration

Goddard Institute for Space Studies

Katia Irma Jose

slide-2
SLIDE 2

2017 ¡North ¡Atlantic ¡Season

Harvey, ¡Texas Maria, ¡Puerto ¡Rico

(5000+ ¡deaths)

Irma, ¡Florida ¡Keys 2017 ¡saw ¡25% ¡of ¡all ¡historical ¡Cat ¡5 ¡landfalls

slide-3
SLIDE 3

But ¡hurricane-­‑climate ¡analysis ¡is ¡based ¡on ¡a ¡long-­‑term ¡view ¡and ¡physical ¡understanding, ¡ not ¡just ¡one ¡active ¡season. ¡Long-­‑term ¡climate ¡impacts ¡on ¡hurricanes ¡include ¡… ¡

  • 1. Sea-­‑level ¡rise ¡leads ¡to ¡greater ¡storm ¡surge.
  • 2. Warmer ¡air, ¡more ¡moisture, ¡more ¡intense ¡rain ¡events.
  • 3. Warmer ¡ocean ¡increases ¡intensity ¡of ¡hurricanes.
  • 4. Changing ¡jet ¡stream ¡leads ¡to ¡more ¡meandering ¡hurricane ¡tracks.
  • 5. Lower ¡atmospheric ¡stability, ¡fewer ¡total ¡tropical ¡cyclones.

more ¡certain less ¡certain

slide-4
SLIDE 4

Sea ¡Level ¡Rise ¡and ¡Storm ¡Surge

0.2 ¡m ¡of ¡global ¡SLR ¡since ¡1880. ¡Additional ¡ 0.3 ¡to ¡2.5m ¡by ¡2100, ¡depending ¡on ¡carbon ¡ emissions ¡and ¡ice-­‑sheet ¡breakup. ¡ Relative ¡sea ¡level ¡rise ¡(m)

slide-5
SLIDE 5

Tampa ¡ranked ¡the ¡most ¡surge-­‑vulnerable ¡city ¡in ¡the ¡US ¡(KCC ¡Report, ¡2015)

  • Shallow ¡coastal ¡water ¡means ¡same ¡

displaced ¡volume ¡of ¡water ¡causes ¡ higher ¡surge.

  • Tampa ¡Bay ¡is ¡a ¡funnel ¡trapping ¡

incoming ¡water. 100-­‑year ¡flood ¡(10 ¡ft surge): ¡$175B 50% ¡of ¡population ¡below ¡10 ¡ft. (KCC ¡Report, ¡2015)

Lin ¡and ¡Emanuel, ¡2015

Tampa ¡surge ¡height ¡for ¡different ¡average ¡ return ¡periods ¡current ¡conditions. ¡ Add ¡30 ¡inches ¡of ¡SLR ¡(red): 100-­‑yr ¡surge ¡is ¡now ¡30-­‑yr ¡surge. ¡

Three ¡times ¡more ¡likely.

Note: ¡3% ¡chance ¡per ¡year ¡à 60% ¡over ¡30-­‑year ¡mortgage

slide-6
SLIDE 6

Hurricane ¡Intensity: ¡The ¡Speed ¡Limit ¡is ¡Increasing

hot ¡ocean warm ¡surface ¡air cold ¡upper ¡atmosphere rising ¡moist ¡air

Air ¡cools, ¡ water ¡vapor ¡ condenses ¡ and ¡rains, ¡ heat ¡released, ¡ fueling ¡more ¡ rising

Difference ¡in ¡ocean ¡and ¡air ¡ temperature ¡fixes ¡ “potential ¡Intensity.” Circulation ¡brings ¡ down ¡cold ¡air ¡from ¡ upper ¡atmosphere, ¡ keeping ¡surface ¡air ¡ cooler ¡than ¡ocean.

Ocean ¡temperature ¡and ¡the ¡vertical ¡variation ¡in ¡atmospheric ¡temperature ¡fix ¡the ¡“potential ¡intensity,” ¡the ¡ thermodynamic ¡Speed ¡Limit ¡on ¡hurricane ¡intensity. ¡The ¡ocean ¡is ¡warming, ¡but ¡the ¡upper ¡atmosphere ¡is ¡not. ¡ That ¡difference ¡drives ¡increased ¡intensity. ¡

  • The ¡Speed ¡Limit ¡is ¡increasing.
  • Not ¡all ¡hurricanes ¡reach ¡their ¡speed ¡limit, ¡but ¡some ¡do ¡(Irma, ¡Maria). ¡
  • Higher ¡speed ¡limit ¡means ¡more ¡hurricanes ¡reach ¡the ¡highest ¡intensity ¡categories.
  • Some ¡will ¡reach ¡intensities ¡never ¡seen ¡historically. ¡ ¡
slide-7
SLIDE 7

Kossin et ¡al, ¡J ¡Clim, ¡2013

Potential ¡Intensity ¡trends ¡1979-­‑2010 ¡and ¡impacts ¡on ¡actual ¡intensity

Hall ¡and ¡Tippett, ¡JAMC, ¡2017 Changes ¡in ¡PI ¡by ¡late ¡21st century ¡in ¡a ¡“business ¡as ¡usual” ¡emissions ¡scenario. ¡Sobel ¡et ¡al., ¡Science, ¡2016

  • Potential ¡Intensity ¡increasing
  • Some ¡reduction ¡in ¡TC ¡frequency.
  • But, ¡greater ¡number ¡reaching ¡highest ¡intensities. ¡

(Lots ¡of ¡ ¡regional ¡uncertainty.)

The ¡destructive ¡energy ¡(“power ¡dissipation”) ¡varies ¡as ¡V3.

(twice ¡the ¡wind ¡speed ¡à 8 ¡times ¡the ¡wind ¡hazard)

It’s ¡the ¡few ¡strongest ¡land-­‑falling ¡hurricanes ¡that ¡do ¡most ¡of ¡the ¡damage. ¡ ¡

slide-8
SLIDE 8

Ocean ¡Heat ¡Content ¡just ¡ before ¡Hurricane ¡Harvey Ocean ¡Heat ¡Content ¡just ¡ after ¡Hurricane ¡Harvey

Where ¡did ¡that ¡heat ¡energy ¡go?

More ¡Ocean ¡Heat ¡à More ¡Water ¡Vapor ¡à More ¡Intense ¡Rain ¡Events

Across ¡US, ¡fraction ¡of ¡rain ¡falling ¡in ¡most ¡intense ¡events ¡is ¡increasing.

When ¡It ¡Rains, ¡It ¡Pours: ¡Hurricane ¡Harvey ¡and ¡the ¡Intensified ¡Hydrologic ¡Cycle

Trenberth ¡et ¡al., ¡2018

20% ¡to ¡38% ¡of ¡Harvey’s ¡rainfall ¡due ¡ to ¡Gulf ¡warming.

Wang ¡et ¡al., ¡ERL, ¡2018.

Harvey ¡rainfall ¡4 ¡times ¡more ¡likely.

Risser and ¡Wehner, ¡GRL, ¡2017. total ¡precipitable water ¡(mm)

All ¡accounted ¡for: ¡heat ¡of ¡ evaporation ¡held ¡by ¡water ¡vapor, ¡ followed ¡by ¡latent ¡heat ¡release ¡ at ¡condensation ¡and ¡two ¡cubic ¡ miles ¡of ¡rain ¡on ¡Houston.

slide-9
SLIDE 9

SST ¡forecast simulations hurricane ¡counts landfall ¡rates

2018 ¡forecasts ¡using ¡stochastic ¡hurricane ¡model ¡(Hall ¡and ¡Yonekura, ¡J. ¡Clim., ¡2013; ¡Hall, ¡InsuranceLinked.com, ¡2017)

2018 ¡Seasonal ¡Hurricane ¡Forecast: ¡Average ¡Activity 2017 2018

But ¡… ¡Andrew, ¡1992 ¡!

https://insurancelinked.com/and-­‑were-­‑off