
SLIDE 1
Florida Transportation Plan Goals
1
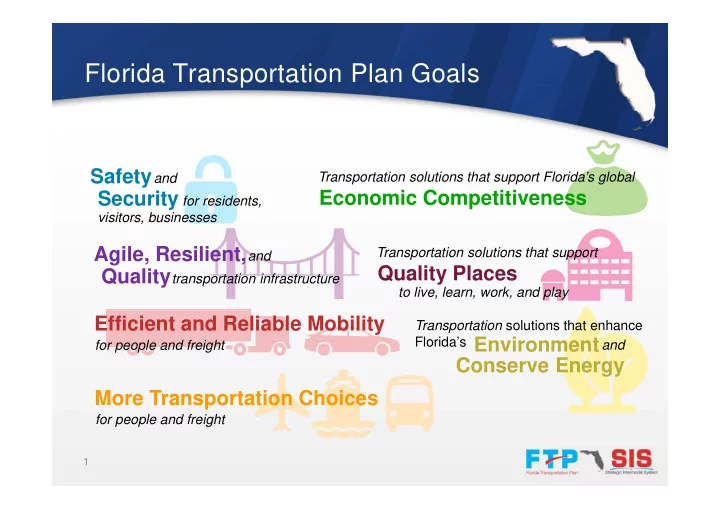
Safety Security
and for residents, visitors, businesses
Efficient and Reliable Mobility
for people and freight
More Transportation Choices
for people and freight Transportation solutions that support Florida’s global
Economic Competitiveness
Transportation solutions that enhance Florida’s Environment and
Conserve Energy
and transportation infrastructure
Agile, Resilient, Quality Quality Places
Transportation solutions that support to live, learn, work, and play