NWS HURRICANES June 5, 2014 Hurricane Season June 1 November 30 2 - - PowerPoint PPT Presentation

nws hurricanes
SMART_READER_LITE
LIVE PREVIEW

NWS HURRICANES June 5, 2014 Hurricane Season June 1 November 30 2 - - PowerPoint PPT Presentation

NWS HURRICANES June 5, 2014 Hurricane Season June 1 November 30 2 Whats the concern? All tropical systems passing within 125nm of central Maryland since 1950 Mid-Atlantic Hurricanes Greatest Risk: August 15 to October 15 However


slide-1
SLIDE 1

NWS HURRICANES

June 5, 2014

slide-2
SLIDE 2

Hurricane Season

June 1 – November 30

2

slide-3
SLIDE 3

What’s the concern?

All tropical systems passing within 125nm of central Maryland since 1950

slide-4
SLIDE 4

Greatest Risk: August 15 to October 15 However…

Mid-Atlantic Hurricanes

  • June (Agnes 1972)
  • July (Bertha 1996)
  • November (Gordon 1994)
slide-5
SLIDE 5

Hurricane

  • Meaning?
  • First thing most think of is WIND
  • One of the biggest problems for safety
  • Dates to Spanish exploration of the Americas.
  • Caribbean word for “God of the Storm”

5

* A storm has SEVERAL threats!

slide-6
SLIDE 6

The 4 Threats

  • Inland Flooding
  • Tidal Flooding
  • Winds <- Saffir-Simpson Wind Scale
  • Tornadoes

6

* Each storm has its own mix of these 4 threats * YOUR threats will depend on this AND where you are

slide-7
SLIDE 7
  • Hurricane or Remnant, threats are same…

The 4 Threats

slide-8
SLIDE 8
  • Hurricane or Remnant, threats are same…
  • Flooding from Torrential Rain

The 4 Threats

slide-9
SLIDE 9
  • Hurricane or Remnant, threats are same…
  • Flooding from Torrential Rain
  • Tidal Flooding from Surge

The 4 Threats

slide-10
SLIDE 10
  • Hurricane or Remnant, threats are same…
  • Flooding from Torrential Rain
  • Tidal Flooding from Surge
  • Tornados

The 4 Threats

slide-11
SLIDE 11
  • Hurricane or Remnant, threats are same…
  • Flooding from Torrential Rain
  • Tidal Flooding from Surge
  • Tornados
  • Winds

The 4 Threats

slide-12
SLIDE 12
  • Flooding from Torrential Rain
  • Probably the most underrated

threat, yet often biggest issue

  • 1-2 FEET of rain can fall
  • An average rainstorm is <1”

The 4 Threats

slide-13
SLIDE 13
  • Flooding from Torrential Rain

The biggest inland killer Often from:

  • Driving into flooded areas
  • Kids playing w/ swollen streams

The 4 Threats

slide-14
SLIDE 14

Flooding

slide-15
SLIDE 15

Lee Remnants ‘11

slide-16
SLIDE 16

The 4 Threats

  • Tidal Flooding from Surge

The most deadly threat for: * those along tidal shores * watch track S or W of you

Think of surge like a slower tsunami

slide-17
SLIDE 17
  • Tornados

Many do not realize it, but hurricanes can produce tornado

  • utbreaks upon landfall.

Affects targeted areas.

The 4 Threats

slide-18
SLIDE 18

Remnants of Ivan produced the worst Mid Atlantic tornado outbreak (35 tornadoes) in recent history (Sept 17, 2004).

  • Tornado production can
  • ccur for days after landfall
  • Any time of day/night

Tornadoes

slide-19
SLIDE 19
  • Winds
  • Typically one of the biggest threats near the landfall region
  • The main threat for mariners
  • Wind speeds usually decrease dramatically after landfall
  • Can have wind gusts above 200 mph

The 4 Threats

slide-20
SLIDE 20

High Winds

Category Winds Damage

Tropical Depression Less than 39 mph Tropical Storm 39-73 mph One 74-95 mph Minimal Two 96-110 mph Moderate Three 111-130 mph Major Four 131-155 mph Extensive Five Greater than 155 mph Catastrophic

Saffir-Simpson Wind Scale

slide-21
SLIDE 21
slide-22
SLIDE 22
  • Hurricane or Remnant, threats are same…
  • Flooding from Torrential Rain
  • Tidal Flooding from Surge
  • Tornados
  • Winds

Which one(s) will impact you & how bad ? Depends on: * storm’s “personality” * your particular area!

The 4 Threats

slide-23
SLIDE 23

National Weather Service

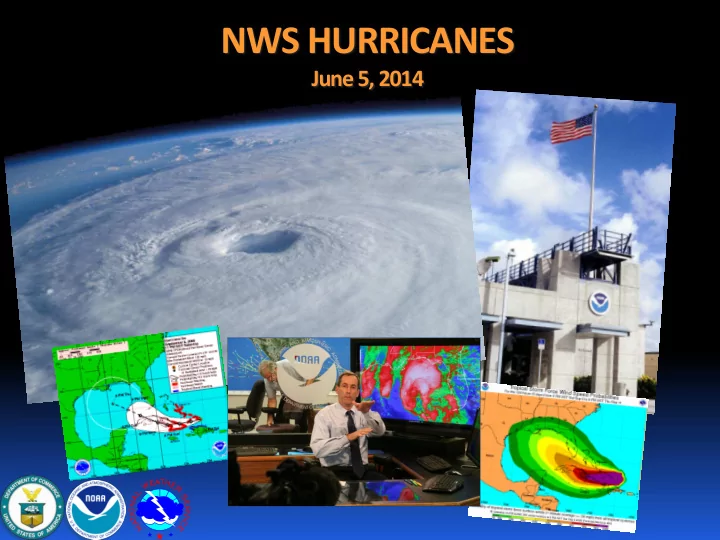
NWS National Hurricane Center Miami, FL Forecasts the track Forecasts the intensity All tropical cyclones around North America! NWS Forecast Office Sterling, VA Forecasts the impacts Forecast the threats For everyone in our local area

Building has 10-inch thick walls made from 3000 cubic yards of concrete, reinforced with 45 miles of steel reinforcing rods

We work together! To decide where & when to issue WATCHES & WARNINGS

slide-24
SLIDE 24

Averages are 12, 6, & 3

slide-25
SLIDE 25

New for 2014 & Trends

  • More
  • GIS
  • Range of Possibilities; Probabilities of ‘x’ happening
  • Not Just Weather, but Impacts
  • Graphics
  • Duration of Forecast
  • Mixed-Case Text From NHC
  • Less
  • Focus on “it will follow this line, with this weather expected”
  • Text products
  • Static Images

25

slide-26
SLIDE 26

Tropical Storm Andrea

Reflects forecast at 5 A.M. Friday Most updated forecast always at weather.gov Issued: 5 A.M. Fri 6/7/13

slide-27
SLIDE 27

National Weather Service Baltimore/Washington

Most Likely Impacts

Heavy Rain (moving in this morning through midnight)

  • Flash Flood Watch: E of the Blue Ridge/Catoctins 6 am - 10 pm

* 2 - 4” E of the Blue Ridge/Catoctins (Heaviest I-95 and east)

+ Flooding likely in I-95 Corridor from Fredericksburg VA to Baltimore

* 0.5 - 1.5” W of the Blue Ridge/Catoctins

  • Heaviest Rainfall: 2 pm to 10 pm Friday

Gusty Winds for Calvert & St. Mary’s Co. MD

* Up to 35 mph Calvert & St. Mary’s Co. MD * 25 MPH or less Elsewhere * Gale Warning on Bay & Potomac Around Their Confluence

Minor Tidal Flooding

* Along Bay & for D.C./Alexandria (1-2’ surge thru eve) * Coastal Flood Advisory for A.M. Tide (D.C./Alexandria & N Bay)

High Impact Scenario

Western Track or Stronger Storm Heavy Rain w/ flooding (Fri/Fri night):

* 4-6” I-95 Corridor and East * 2-4” W of I-95 Corridor

Gusty winds (along Bay counties):

* 40 mph gusts

* A few downed trees/power lines

Isolated Tornado (S MD) Gales on entire Bay Tidal Flooding:

* Moderate for Bay &Lwr Potmc (2-3’ surge) * Minor along mid/upr Potomac (1-2’ surge)

Impacts from Andrea

Baltimore/Washington Region Threat Window (Fri morning – Fri night)

Low Impact Scenario

Eastern Track or Weaker Storm Rain

* 1-2” Blue Ridge and east * Less than 1” west of the Blue Ridge

Range of Threat Window of possibilities will narrow as we near event, with added detail

Issued: 9 A.M. Fri 6/7/13

NWS Baltimore/Washington

Reflects forecast at 9 A.M. Friday Most updated forecast always at weather.gov

slide-28
SLIDE 28

Beginnings of Inundation Mapping

  • Starts w/ Hurricane Watch
  • “Possibly” Tropical Storm Watch
  • Worst-Case Scenario

(potential)

  • Feet Above Ground
  • 6-hr updates
  • 1hr after NHC update

28

slide-29
SLIDE 29

Graphical NHC Outlooks

  • Thru 5 days
  • Initial Position X
  • Expected Movement / Threat Area

29

slide-30
SLIDE 30

mobile.weather.gov

Save to home screen

slide-31
SLIDE 31

Hour-by-Hour Forecast

slide-32
SLIDE 32

Social Media

slide-33
SLIDE 33

Warning Type WEA Message Tsunami Warning Tsunami danger on the coast. Go to high ground or move inland. Check local media. –NWS Tornado Warning Tornado Warning in this area til hh:mm tzT. Take shelter now. Check local media. –NWS Extreme Wind Warning Extreme Wind Warning this area til hh:mm tzT ddd. Take shelter. –NWS Flash Flood Warning Flash Flood Warning this area til hh:mm tzT. Avoid flooded areas. Check local media. -NWS Hurricane Warning Hurricane Warning this area til hh:mm tzT ddd. Check local media and authorities. –NWS Typhoon Warning Typhoon Warning this area til hh:mm tzT ddd. Check local media and authorities. -NWS Dust Storm Warning Dust Storm Warning in this area til hh:mm tzT ddd. Avoid travel. Check local media. -NWS

slide-34
SLIDE 34

Summary

  • Full information set = (Most likely / The forecast) + (Best & Worst case scenarios)
  • Greatest Risk is mid Aug – mid Oct
  • 4 Threats
  • Flooding
  • Tidal Flooding
  • Wind
  • Tornadoes
  • Forecast Offices + NHC = NWS team

34

slide-35
SLIDE 35

Weather-Ready Nation

Weather Disasters will come… If everyone… …gets advance notice …knows what to do & acts …is prepared …we will truly be a Weather-Ready Nation!

NOAA National Weather Service

Chris Strong – Warning Coordination Meteorologist (WCM) christopher.strong @ noaa.gov 703-996-2223