
SLIDE 1
Greg Gust gregory.gust@noaa.gov NOAA/NWS Grand Forks ND 20 March - - PowerPoint PPT Presentation
Greg Gust gregory.gust@noaa.gov NOAA/NWS Grand Forks ND 20 March 2019 2019 RRWMB and FDRWG 21 st Annual Joint Conference, Moorhead MN Extreme Continentality! We are Land Locked... Farthest from the moderating affects of oceans. Battle
Greg Gust gregory.gust@noaa.gov NOAA/NWS Grand Forks ND 20 March 2019
2019 RRWMB and FDRWG 21st Annual Joint Conference, Moorhead MN
We are Land Locked...
Farthest from the moderating affects of oceans. Battle ground of extreme airmasses (arctic/tropical). Highest annual, seasonal, weekly...
...and diurnal variability in Temp/Precip.
What are MN’s record hottest and record coldest Temps?
93F/79F
92F/82F
90F/86F
94F/81F
96F/82F
87F/84F
110F
90F/81F
105F
95F/88F
95F/83F
116F
91F/89F
92F/81F
95F/75F
107F
83F/73F
87F
82F/73F
86F
99F/81F
19 July 2011
A Northern Plains Extreme Heat Episode…
Tx = Max Temp (F) TDx = Max DewPt HIx = Mx Heat Index
Tx/TDx
*note: HIx did not always
90F/83F
31 32 33 34 35 36 37 38 39 40 41 2009 1997 1897 2011 1969 2006 2010 2001 1989 1979 40.84 39.72 39.10 38.77 37.34 37.13 36.99 36.69 35.39 34.93
2011 Peak Ranks 4th in 111 Years of Record
29,500 cfs
2011 Exceedance Probability (.02 -.01)
26,200 cfs
Original analysis courtesy of Chris LaVeau, USGS Office, Grand Forks ND
1 2 3 4 1979 2006 2001 1997 2010 2009 2011
0.92 1.39 1.61 1.90 2.09 2.53 3.20
Million Acre-ft 05054000 Annual Volume of Water (Oct.-Sept.)
[Current as of 8pm 20 Mar 2019]
North Central River Forecast Center Chanhassen, MN
Building a Weather-Ready Nation
13
Courtesy Prof. David Hopkins, NDSU, Photo by John Nowatski South of Red River Valley Fairgrounds August 22, 2012
North Central River Forecast Center Chanhassen, MN
Building a Weather-Ready Nation
14 2.33 2.25 4.2 2.85 1.5 5 5.2 5.9 1.84 7.05
1 2 3 4 5 6 7 8 0% 20% 40% 60% 80% 100% 120% SWE (inches) Percent Runoff
Snow Water Equivalent (SWE) vs Runoff Efficiency
SWE
2009 2011 2010
Mike DeWeese, NCRFC
2013
[Then 2012 Drought to 2013 Flood]
Lessons learned from Jody’s Talk on Wednesday: Understanding Conflict!
From Chad Engels, Moore Engineering... Note the addition of several recent NDAWN/USGS sponsored deep soil moisture and temperature stations!
9 of 16 New NDAWN/USGS soil Temp/Moisture stations in the RRB
The Use of Seasonal-Scale Climate Tools as aids in Determining Snowmelt Flood Risk
Steve Buan, NOAA/NCRFC Chanhassen MN
Poster 6 Your Photo
Climate tools help move us from a Possibility to a Probability to a “Number”
...in the hydrologic outlook and forecast process.
From AHPS, first fielded here in FY2000 Through HEFS, spreading basin-wide now Climate Data and Outlooks help us to define and illustrate our shared Risk!
And welcome to my hydrologic nightmare: Fargo ND!
1. 2. 3.
Tough to extend the Forecast more than 7 days into the future… so much “noise”
[as used in AHPS Probabilities]
[as used in developmental HEFS]
An ECCC and NOAA Bilateral agreement “project” addresses cross-border collaboration and coordination of alerts for extremes of Heat and Cold
Gregory Gust - Warning Coordination Meteorologist,
NOAA/NWS Grand Forks ND
The current NCEP process uses reforecast-calibrated GEFS to derive a full probability distribution function (PDF), which allows one to determine probabilities of multiple element thresholds. But... It’s for internal NCEP access only! (re: Dan Collins et al)
Used in NCEP Day 8-14 Prob Hazards NEW At our request, Melissa Ou and others at NCEP are working on expanded temp and precip
...for (eventual) Field Office Access and Use! Expanded Area: AK/HI and Canada
Expanded Forecast Options, for Public Health Emphasis!
May 2018
https://www.cpc.ncep.noaa.gov/products/predictions/threats/extremesTool.php
With the risk for Min Temps below 32F very low on Day 8 (3/28)… This means overnight thaw and movement of water into streams. But much higher after Day 10 (3/30 into 4/03)… which shuts the thaw back down.
https://www.cpc.ncep.noaa.gov/products/predictions/threats/extremesTool.php
With the risk for Min Temps below 32F very low on Day 8 (3/28)… This means overnight thaw and movement of water into streams. But much higher after Day 10 (3/30 into 4/03)… which shuts the thaw back down.
https://www.cpc.ncep.noaa.gov/products/predictions/threats/extremesTool.php
Greg Gust gregory.gust@noaa.gov NOAA/NWS Grand Forks ND 21 March 2019
moving across the landscape towards the rivers.
especially along and near the mainstem Red.
Risk is up another notch. Nearly everybody’s in the pool now!
(Snowpack and SWE are now approaching extreme!)
The Far North RRB was still Abnormally Dry at freeze-up …and not as extreme for snowfall !!
Moisture last 7 days was high: 1.5 to 2 in., Fargo and points south and east
Moisture last 7 days was high all over… and could have been a lot worse!
73.3 59.1
Snow Water Equiv (SWE) is BIG… Top 10 Ranking (of 120+ years) Much of the RRB is now in the 90th percentile for SWE! Good News: We’re not in the 99th percentile!!
This is the amount of total moisture, rain and snow… For the Water Year beginning October 1st... Through now. To date, Grand Forks has had 7.44 inches of moisture, (3.2” above normal) Fargo-Moorhead has had 8.38 inches of moisture, (3.7” above normal)
Above Normal - Spring 1997 Above Normal - Spring 2009
Excess Precipitation from Oct 1st through Apr 15th was higher in 2009 than 1997…
Note: This compares WY2019-to-date (15 Mar 2019) compared to total precipitation for BIG Flood Years through April 30th.
Soil moisture is high… 70th to 90th percentile south of Grand Forks, nearer normal north.
NDAWN Soil Temperatures added as filled circles, same legend colors.
Sheyenne River, dark blue, artificially high due to DVL through-flow and subsequent Baldhill Dam drawdown.
[ Near Normal for us!]
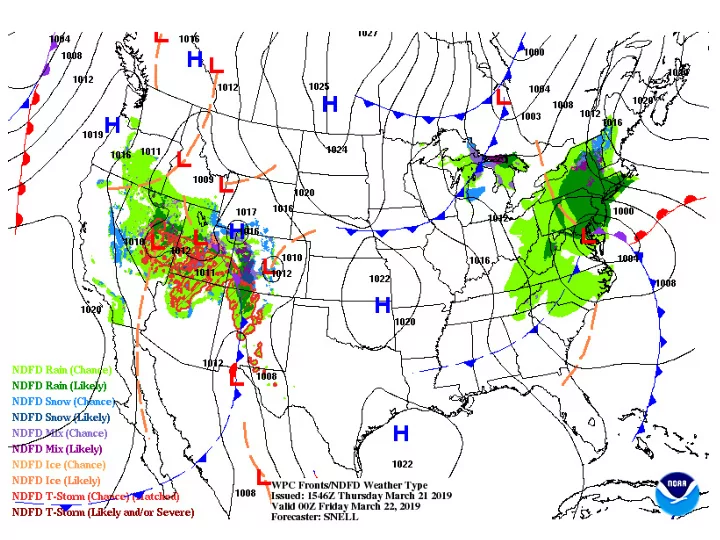
Active/Wet pattern across the Central Plains continues for a while more.
Melting Degrees How Many Hours will we be above 30F (or 32F)? At 60-100 hrs we usually start to see streamflow in those areas of multi-day thaw. A drop below 30F (32F) resets counter to zero. We closely watch what has already
what is forecast
Building a Weather-Ready Nation
[Normalish… but Mixed Precip, into Apr 2]
Building a Weather-Ready Nation
[Optimistic: Less Cold and Somewhat Drier!]
Building a Weather-Ready Nation
https://water.weather.gov/ahps2/index.php?wfo=FGF
(possible flood wall/bridge closures, rural roads affected)
(F-M Toll Bridge and 1st Ave Bridge closed, Sandbagging?)
An Experimental Product Only for the 8 mainstem Red River locations. At a Glance,
years,
Let us know what you think!
https://www.weather.gov/fgf/PFOS
(breakouts flows, ag flooding, road closures at 25ft. Hwy 10 east of Glyndon floods)
(breakouts flows, ag flooding, road closures at 31ft. Water against Hwy 25 bridge)
(Hwy 75 closures at 38 ft., Top of dike at 44 ft.)
An Experimental Product Only for the 8 mainstem Red River locations. At a Glance,
years,
Let us know what you think!
https://www.weather.gov/fgf/PFOS
(breakouts flows, ag flooding, at 26 ft. Hwy 75 (north) closed, at 29ft. Hwy 220 (west) closed)
(dike patrols, evacuation planning, ice jam susceptible)
(closures at Sorlie and RR Bridge, Hill Street EGF)
(local breakouts near railroad road and tracks)
(possible road closures east and west of town, wide overland)
An Experimental Product Only for the 8 mainstem Red River locations. At a Glance,
years,
Let us know what you think!
https://www.weather.gov/fgf/PFOS
(manning pumps and lift stations, dikes at 812ft.)
(flood wall and road closures, dike patrols, Interstate?)
(flood diversion in play at 13 ft., but…expect some breakouts up/downstream from Roseau)
An Experimental Product Only for the 8 mainstem Red River locations. At a Glance,
years,
Let us know what you think!
https://www.weather.gov/fgf/PFOS
[15 Mar 2019 outlook]
Similar years… 2011 is starting to look like a more similar year (at 50th percentile), while a perfect thaw cycle year would be more like 2013 flows.
Similar years… 2011 or 2010 start to look like more similar years (at 50th percentile), while a perfect thaw cycle year would be more like 2013 flows (southeast ND).
moving across the landscape towards the rivers.
especially along and near the mainstem Red.
A web-based, app- like feature. The IWI and RRBC are working with the NWS to bring this back online for the 2019 Flood! If/when available will need you help to get the work out!
A web-based, app- like feature. The IWI and RRBC are working with the NWS to bring this back online for the 2019 Flood! If/when available will need you help to get the work out!