
SLIDE 1
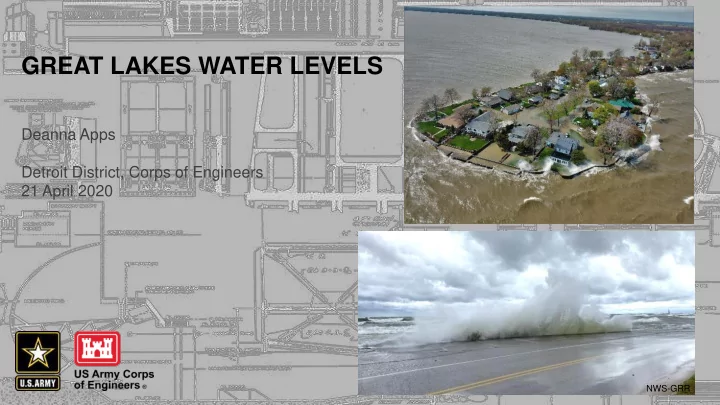
GREAT LAKES WATER LEVELS
Deanna Apps Detroit District, Corps of Engineers 21 April 2020
NWS-GRR
GREAT LAKES WATER LEVELS Deanna Apps Detroit District, Corps of - - PowerPoint PPT Presentation
GREAT LAKES WATER LEVELS Deanna Apps Detroit District, Corps of Engineers 21 April 2020 NWS-GRR 2 HIGH WATER PHOTOS FROM ACROSS THE GL South Haven, MI Canal Park (NWS) Near Duluth, MN (NWS) Stony Point, MI Oswego, NY Lake Erie (Bill
NWS-GRR
2
Canal Park Near Duluth, MN (NWS) Stony Point, MI Lake Erie (Port of Monroe) South Haven, MI (NWS) Oswego, NY (Bill Foley)
3
4
5
6
7
Snow accumulation
Snow melt, rainfall, increased runoff
Increased sunshine warms lake water Increased evaporation
8
9
10
NOAA National Centers for Environmental information, Climate at a Glance
Image: 60-month period
11
12
13
14
https://www.lre.usace.army.mil/Missions/Great-Lakes-Information/Great-Lakes-Water-Levels/Water-Level-Forecast/
15
https://www.lre.usace.army.mil/Missions/Great-Lakes-Information/Great-Lakes-Water-Levels/Water-Level-Forecast/
16
https://www.lre.usace.army.mil/Missions/Great-Lakes-Information/Great-Lakes-Water-Levels/Water-Level-Forecast/
17
https://www.lre.usace.army.mil/Missions/Great-Lakes-Information/Great-Lakes-Water-Levels/Water-Level-Forecast/
18
https://www.lre.usace.army.mil/Missions/Great-Lakes-Information/Great-Lakes-Water-Levels/Water-Level-Forecast/
19
20
21