. . How would you group . . . . . . . . . . The price of - - PDF document

how would you group the price of crude oil has increased
SMART_READER_LITE
LIVE PREVIEW

. . How would you group . . . . . . . . . . The price of - - PDF document

12/11/17 What is Clustering? Clustering: k-means, Expectation-Maximization Given some instances of data: group them such that Ethics: Ethical Questions in AI Examples within a group are similar Examples in different groups are


slide-1
SLIDE 1

12/11/17 1

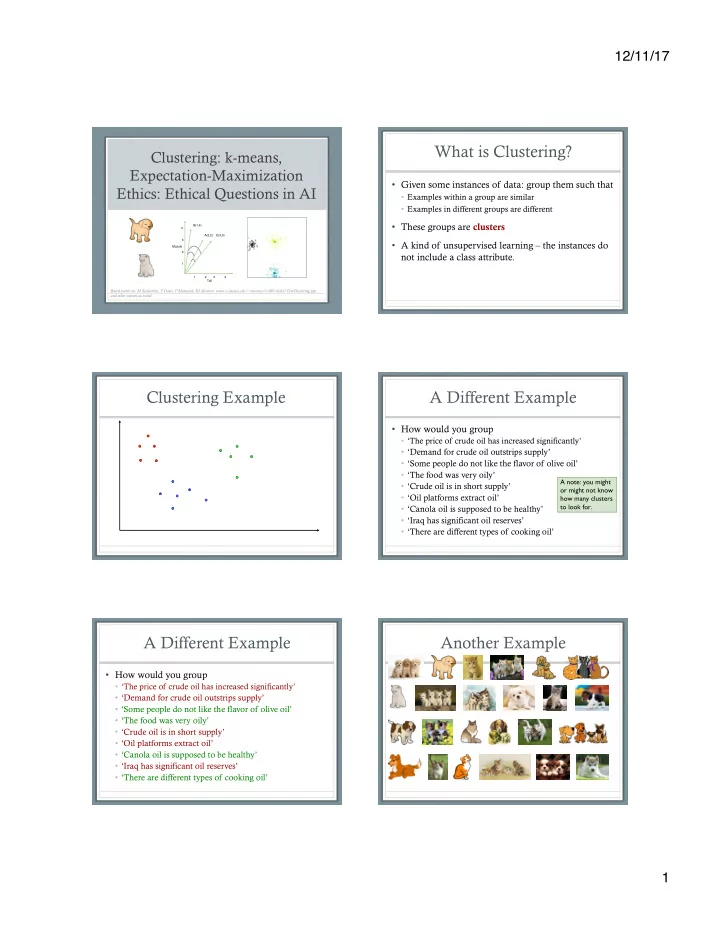
Clustering: k-means, Expectation-Maximization Ethics: Ethical Questions in AI

Based partly on: M desJardins, T Oates, P Matuszek, RJ Mooney: www.cs.utexas.edu/~mooney/cs388/slides/TextClustering.ppt, and other sources as noted

1 2 3 4 Muzzle 1 2 3 4 A(3,2) B(1,4) C(3,3) Tail

What is Clustering?

  • Given some instances of data: group them such that
  • Examples within a group are similar
  • Examples in different groups are different
  • These groups are clusters
  • A kind of unsupervised learning – the instances do

not include a class attribute.

.

Clustering Example

. . . . . . . . . . . . . . . . . . . . . . . . . . . . . . .

A Different Example

  • How would you group
  • ‘The price of crude oil has increased significantly’
  • ‘Demand for crude oil outstrips supply’
  • ‘Some people do not like the flavor of olive oil’
  • ‘The food was very oily’
  • ‘Crude oil is in short supply’
  • ‘Oil platforms extract oil’
  • ‘Canola oil is supposed to be healthy’
  • ‘Iraq has significant oil reserves’
  • ‘There are different types of cooking oil’

A note: you might

  • r might not know

how many clusters to look for.

A Different Example

  • How would you group
  • ‘The price of crude oil has increased significantly’
  • ‘Demand for crude oil outstrips supply’
  • ‘Some people do not like the flavor of olive oil’
  • ‘The food was very oily’
  • ‘Crude oil is in short supply’
  • ‘Oil platforms extract oil’
  • ‘Canola oil is supposed to be healthy’
  • ‘Iraq has significant oil reserves’
  • ‘There are different types of cooking oil’

Another Example

slide-2
SLIDE 2

12/11/17 2

Some Example Uses Clustering Basics

  • Collect examples
  • Compute similarity among examples according to

some metric

  • Group examples together such that:
  • 1. Examples within a cluster are similar
  • 2. Examples in different clusters are different
  • Summarize each cluster
  • Sometimes: assign new instances to the cluster it I

most similar to

Measures of Similarity

  • To do clustering we need some measure of similarity.
  • This is basically our “critic”
  • Computed over a vector of values representing instances
  • Types of values depend on domain:
  • Documents: bag of words, linguistic features
  • Purchases: cost, purchaser data, item data
  • Census data: most of what is collected
  • Multiple different measures exist

Measures of Similarity

  • Semantic similarity (but that’s hard)
  • For example, olive oil/crude oil
  • Similar attribute counts
  • Number of attributes with the same value
  • Appropriate for large, sparse vectors
  • Bag-of-Words: BoW
  • More complex vector comparisons:
  • Euclidean Distance
  • Cosine Similarity

Euclidean Distance

  • Euclidean distance: distance between two measures

summed across each feature dist(xi, xj) = sqrt((xi1-xj1)2+(xi2-xj2)2+..+(xin-xjn)2)

  • Squared differences give more weight to larger

differences

  • dist([1,2],[3,8]) = sqrt((1-3)2+(2-8)2) =

sqrt((-2)2+(-6)2) = sqrt(4+36) = sqrt(40) = ~6.3

Euclidean

  • Calculate differences
  • Ears: pointy?
  • Muzzle: how many inches long?
  • Tail: how many inches long?

dist(x1, x2) = sqrt((0-1)2+(3-1)2+..+(2-4)2)=sqrt(9)=3 dist(x1, x3) = sqrt((0-0)2+(3-3)2+..+(2-3)2)=sqrt(1)=1

slide-3
SLIDE 3

12/11/17 3

Based on home.iitk.ac.in/~mfelixor/Files/non-numeric-Clustering-seminar.ppt, with thanks

Cosine Similarity

  • A measure of similarity between vectors
  • Find cosine of the angle between them
  • Cosine = 1 when angle = 0
  • Cosine < 1 otherwise
  • As angle between vectors shrinks,

θ approaches 1

  • Meaning: the two vectors are getting closer
  • Meaning: the similarity of whatever is

represented by the vectors increases

  • Vectors can have any number of dimensions

x y <x1,y1> <x2,y2> θ

Cosine Similarity

1 2 3 4 Muzzle 1 2 3 4 A(3,2) B(1,4) C(3,3) Tail

Most similar?

Euclidean Distance vs Cosine Similarity vs Other

  • Cosine Similarity:
  • Measures relative proportions of various features
  • Ignores magnitude
  • When all the correlated dimensions between two vectors are in

proportion, you get maximum similarity

  • Euclidean Distance:
  • Measures actual distance between two points
  • More concerned with absolutes
  • Often similar in practice, especially on high dimensional data
  • Consider meaning of features/feature vectors for your domain

Justin Washtell @ semanticvoid.com/blog/2007/02/23/similarity-measure-cosine-similarity-or-euclidean-distance-or-both/

Clustering Algorithms

  • Flat:
  • K means
  • Hierarchical:
  • Bottom up
  • Top down (not common)
  • Probabilistic:
  • Expectation Maximization (E-M)

Partitioning (Flat) Algorithms

  • Partitioning method
  • Construct a partition of n instances into a set of k clusters
  • Given: a set of documents and the number k
  • Find: a partition of k clusters that optimizes the

chosen partitioning criterion

  • Globally optimal: exhaustively enumerate all partitions.
  • Usually too expensive.
  • Effective heuristic methods: k-means algorithm.

www.csee.umbc.edu/~nicholas/676/MRSslides/lecture17-clustering.ppt

k-means Clustering

  • Simplest hierarchical method, widely used
  • Create clusters based on a centroid; each

instance is assigned to the closest centroid

  • K is given as a parameter
  • Heuristic and iterative
slide-4
SLIDE 4

12/11/17 4

k-means Algorithm

  • 1. Choose k (the number of clusters)
  • 2. Randomly choose k instances to center clusters on
  • 3. Assign each point to the centroid it’s closest to,

forming clusters

  • 4. Recalculate centroids of new clusters
  • 5. Reassign points based on new centroids
  • 6. Iterate until…
  • 7. Convergence (no point is reassigned) or after a fixed

number of iterations.

19

K Means Example (K=2)

www.youtube.com/watch?v=5I3Ei69I40s

  • 1. randomly place centroids
  • 2. iteratively:
  • assign points to closest centroid, forming clusters
  • calculate centroids of new clusters
  • 3. until convergence

This (happens to be) a pretty good random initialization!

k-means

  • Tradeoff between having more clusters (better focus

within each cluster) and having too many clusters.

  • Overfitting is a possibility with too many!
  • Results depend on random seed selection.
  • Some seeds can result in slow convergence or convergence

to poor clusters

  • Algorithm is sensitive to outliers
  • Data points that are very far from other data points
  • Could be errors, special cases, …

www.csee.umbc.edu/~nicholas/676/MRSslides/lecture17-clustering.ppt

Problem: Bad Initial Seeds

datasciencelab.wordpress.com/2014/01/15/improved-seeding-for-clustering-with-k-means/

Advantages

  • Easy to understand, implement
  • Most popular clustering

algorithm

  • Efficient, almost linear
  • Time complexity: O(tkn)
  • n = number of data points
  • k = number of clusters
  • t = number of iterations.
  • In practice, performs well

(especially on text)

Disadvantages

  • Must choose k beforehand
  • Bad k à bad clusters
  • Sometimes we don’t know
  • Sensitive to initialization
  • One fix: run several times with

different random centers and look for agreement

  • Sensitive to outliers, irrelevant

features

25

Evaluation of k-means

Expectation Maximization Clustering

  • Expectation-Maximization is a core ML algorithm
  • Not just for clustering!
  • Basic idea: assign instances to clusters

probabilistically rather than absolutely

  • Instead of assigning membership in a group, learn a

probability function for each group

  • Instead of absolute assignments, output is

probability of each instance being in each cluster

28

slide-5
SLIDE 5

12/11/17 5

EM Clustering Algorithm

  • Goal: maximize overall probability of data
  • Iterate between:
  • Expectation: estimate probability that each instance

belongs to each cluster

  • Maximization: recalculate parameters of probability

distribution for each cluster

  • Until convergence or iteration limit.

29

Expectation Maximization (EM)

  • Probabilistic method for soft clustering
  • Idea: learn k classifications from unlabeled data
  • Assumes k clusters:{c1, c2,… ck}
  • “Soft” version of k-means
  • Assumes a probabilistic model of categories (such as

Naive Bayes)

  • Allows computing P(ci | I) for each category, ci, for a

given instance I

(Slightly) More Formally

  • Iteratively learn probabilistic categorization model from

unsupervised data

  • Initially assume random assignment of examples to categories
  • “Randomly label” data
  • Learn initial probabilistic model by estimating model

parameters θ from randomly labeled data

  • Iterate until convergence:
  • Expectation (E-step):
  • Compute P(ci | I) for each instance (example) given the current model
  • Probabilistically re-label the examples based on these posterior probability estimates
  • Maximization (M-step): Re-estimate model parameters, θ, from re-labeled data

EM

Unlabeled Examples

+ − + − + − + − − +

Assign random probabilistic labels to unlabeled data

Initialize:

https://www.mathworks.com/matlabcentral/fileexchange/24867-gaussian-mixture-model-m

EM

Prob. Learner

+ − + − + − + − − +

Give soft-labeled training data to a probabilistic learner

Initialize:

EM

Prob. Learner

Prob. Classifier

+ − + − + − + − − +

Produce a probabilistic classifier

Initialize:

slide-6
SLIDE 6

12/11/17 6

EM

Prob. Learner

Prob. Classifier

Relabel unlabled data using the trained classifier

+ − + − + − + − − +

E Step:

+ − + − + − + − − +

EM

Prob. Learner

Prob. Classifier

Continue EM iterations until probabilistic labels

  • n unlabeled data converge.

Retrain classifier on relabeled data

M step:

+ − + − + − + − − +

EM Summary

  • Basically a probabilistic k-means.
  • Has many of same advantages and disadvantages
  • Results are easy to understand
  • Have to choose k ahead of time
  • Useful in domains when we want likelihood that an

instance belongs to more than one cluster

  • Natural language processing for instance